Immigrants from Afghanistan vs Immigrants from Vietnam Associate's Degree
COMPARE
Immigrants from Afghanistan
Immigrants from Vietnam
Associate's Degree
Associate's Degree Comparison
Immigrants from Afghanistan
Immigrants from Vietnam
47.3%
ASSOCIATE'S DEGREE
74.3/ 100
METRIC RATING
152nd/ 347
METRIC RANK
45.2%
ASSOCIATE'S DEGREE
20.8/ 100
METRIC RATING
201st/ 347
METRIC RANK
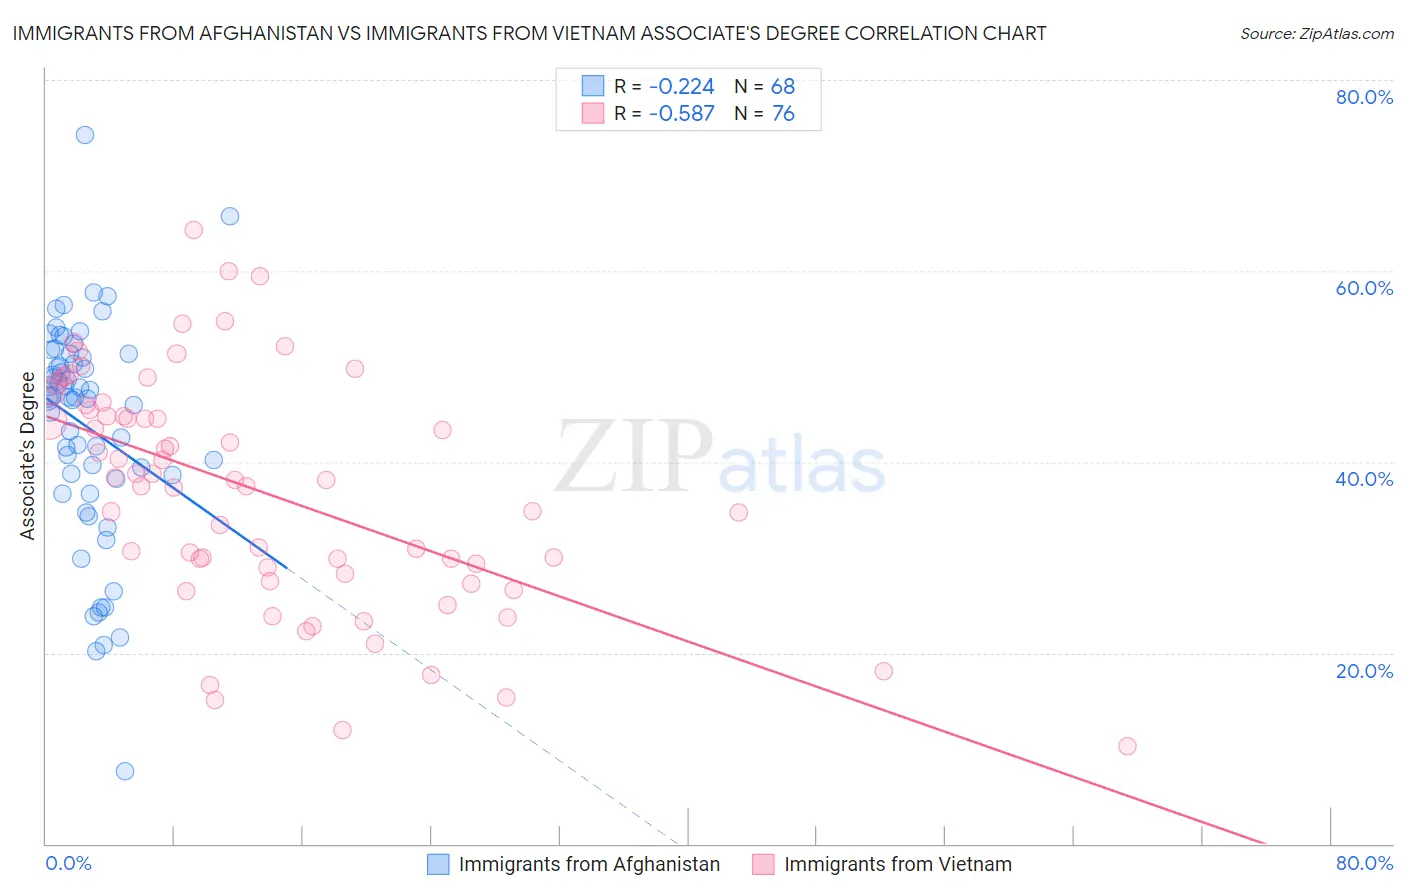
Immigrants from Afghanistan vs Immigrants from Vietnam Associate's Degree Correlation Chart
The statistical analysis conducted on geographies consisting of 147,646,385 people shows a weak negative correlation between the proportion of Immigrants from Afghanistan and percentage of population with at least associate's degree education in the United States with a correlation coefficient (R) of -0.224 and weighted average of 47.3%. Similarly, the statistical analysis conducted on geographies consisting of 404,825,690 people shows a substantial negative correlation between the proportion of Immigrants from Vietnam and percentage of population with at least associate's degree education in the United States with a correlation coefficient (R) of -0.587 and weighted average of 45.2%, a difference of 4.6%.
Associate's Degree Correlation Summary
| Measurement | Immigrants from Afghanistan | Immigrants from Vietnam |
| Minimum | 7.6% | 10.2% |
| Maximum | 74.2% | 64.3% |
| Range | 66.6% | 54.0% |
| Mean | 43.7% | 36.9% |
| Median | 46.7% | 38.1% |
| Interquartile 25% (IQ1) | 38.4% | 28.6% |
| Interquartile 75% (IQ3) | 51.1% | 45.7% |
| Interquartile Range (IQR) | 12.7% | 17.1% |
| Standard Deviation (Sample) | 11.6% | 12.1% |
| Standard Deviation (Population) | 11.5% | 12.0% |
Similar Demographics by Associate's Degree
Demographics Similar to Immigrants from Afghanistan by Associate's Degree
In terms of associate's degree, the demographic groups most similar to Immigrants from Afghanistan are Immigrants from North Macedonia (47.4%, a difference of 0.17%), Iraqi (47.4%, a difference of 0.19%), Czech (47.2%, a difference of 0.19%), Immigrants from Kenya (47.2%, a difference of 0.20%), and Immigrants from Armenia (47.4%, a difference of 0.23%).
| Demographics | Rating | Rank | Associate's Degree |
| Canadians | 79.0 /100 | #145 | Good 47.5% |
| Immigrants | Sudan | 77.9 /100 | #146 | Good 47.4% |
| Danes | 77.3 /100 | #147 | Good 47.4% |
| South American Indians | 76.7 /100 | #148 | Good 47.4% |
| Immigrants | Armenia | 76.6 /100 | #149 | Good 47.4% |
| Iraqis | 76.2 /100 | #150 | Good 47.4% |
| Immigrants | North Macedonia | 76.0 /100 | #151 | Good 47.4% |
| Immigrants | Afghanistan | 74.3 /100 | #152 | Good 47.3% |
| Czechs | 72.2 /100 | #153 | Good 47.2% |
| Immigrants | Kenya | 72.1 /100 | #154 | Good 47.2% |
| Kenyans | 70.6 /100 | #155 | Good 47.1% |
| South Americans | 70.5 /100 | #156 | Good 47.1% |
| Sudanese | 70.3 /100 | #157 | Good 47.1% |
| Immigrants | Germany | 69.7 /100 | #158 | Good 47.1% |
| Immigrants | Poland | 69.2 /100 | #159 | Good 47.1% |
Demographics Similar to Immigrants from Vietnam by Associate's Degree
In terms of associate's degree, the demographic groups most similar to Immigrants from Vietnam are Senegalese (45.2%, a difference of 0.030%), Immigrants from Senegal (45.2%, a difference of 0.040%), Spaniard (45.2%, a difference of 0.050%), Immigrants from Bangladesh (45.2%, a difference of 0.060%), and Immigrants from South Eastern Asia (45.2%, a difference of 0.070%).
| Demographics | Rating | Rank | Associate's Degree |
| Immigrants | Peru | 27.6 /100 | #194 | Fair 45.5% |
| Germans | 26.5 /100 | #195 | Fair 45.5% |
| French | 25.6 /100 | #196 | Fair 45.4% |
| Scotch-Irish | 22.3 /100 | #197 | Fair 45.3% |
| Immigrants | Bangladesh | 21.3 /100 | #198 | Fair 45.2% |
| Immigrants | Senegal | 21.2 /100 | #199 | Fair 45.2% |
| Senegalese | 21.1 /100 | #200 | Fair 45.2% |
| Immigrants | Vietnam | 20.8 /100 | #201 | Fair 45.2% |
| Spaniards | 20.4 /100 | #202 | Fair 45.2% |
| Immigrants | South Eastern Asia | 20.2 /100 | #203 | Fair 45.2% |
| Nigerians | 19.1 /100 | #204 | Poor 45.1% |
| Immigrants | Thailand | 18.9 /100 | #205 | Poor 45.1% |
| German Russians | 18.9 /100 | #206 | Poor 45.1% |
| Panamanians | 18.4 /100 | #207 | Poor 45.1% |
| Dutch | 17.6 /100 | #208 | Poor 45.0% |