Immigrants from Afghanistan vs Shoshone Associate's Degree
COMPARE
Immigrants from Afghanistan
Shoshone
Associate's Degree
Associate's Degree Comparison
Immigrants from Afghanistan
Shoshone
47.3%
ASSOCIATE'S DEGREE
74.3/ 100
METRIC RATING
152nd/ 347
METRIC RANK
38.4%
ASSOCIATE'S DEGREE
0.0/ 100
METRIC RATING
306th/ 347
METRIC RANK
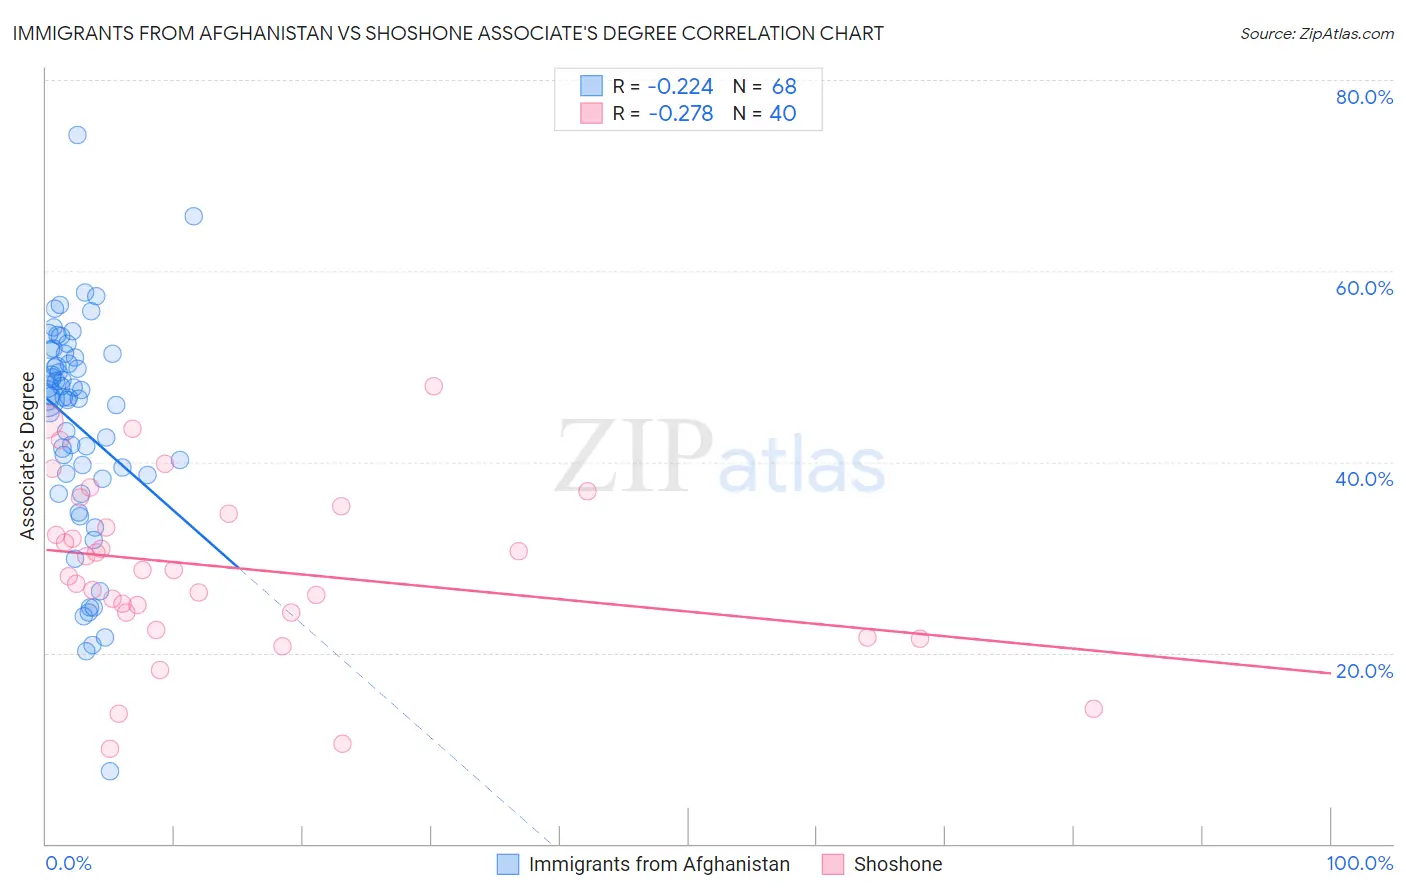
Immigrants from Afghanistan vs Shoshone Associate's Degree Correlation Chart
The statistical analysis conducted on geographies consisting of 147,646,385 people shows a weak negative correlation between the proportion of Immigrants from Afghanistan and percentage of population with at least associate's degree education in the United States with a correlation coefficient (R) of -0.224 and weighted average of 47.3%. Similarly, the statistical analysis conducted on geographies consisting of 66,627,351 people shows a weak negative correlation between the proportion of Shoshone and percentage of population with at least associate's degree education in the United States with a correlation coefficient (R) of -0.278 and weighted average of 38.4%, a difference of 23.0%.
Associate's Degree Correlation Summary
| Measurement | Immigrants from Afghanistan | Shoshone |
| Minimum | 7.6% | 9.9% |
| Maximum | 74.2% | 47.9% |
| Range | 66.6% | 38.0% |
| Mean | 43.7% | 28.9% |
| Median | 46.7% | 28.7% |
| Interquartile 25% (IQ1) | 38.4% | 24.2% |
| Interquartile 75% (IQ3) | 51.1% | 35.0% |
| Interquartile Range (IQR) | 12.7% | 10.7% |
| Standard Deviation (Sample) | 11.6% | 9.0% |
| Standard Deviation (Population) | 11.5% | 8.8% |
Similar Demographics by Associate's Degree
Demographics Similar to Immigrants from Afghanistan by Associate's Degree
In terms of associate's degree, the demographic groups most similar to Immigrants from Afghanistan are Immigrants from North Macedonia (47.4%, a difference of 0.17%), Iraqi (47.4%, a difference of 0.19%), Czech (47.2%, a difference of 0.19%), Immigrants from Kenya (47.2%, a difference of 0.20%), and Immigrants from Armenia (47.4%, a difference of 0.23%).
| Demographics | Rating | Rank | Associate's Degree |
| Canadians | 79.0 /100 | #145 | Good 47.5% |
| Immigrants | Sudan | 77.9 /100 | #146 | Good 47.4% |
| Danes | 77.3 /100 | #147 | Good 47.4% |
| South American Indians | 76.7 /100 | #148 | Good 47.4% |
| Immigrants | Armenia | 76.6 /100 | #149 | Good 47.4% |
| Iraqis | 76.2 /100 | #150 | Good 47.4% |
| Immigrants | North Macedonia | 76.0 /100 | #151 | Good 47.4% |
| Immigrants | Afghanistan | 74.3 /100 | #152 | Good 47.3% |
| Czechs | 72.2 /100 | #153 | Good 47.2% |
| Immigrants | Kenya | 72.1 /100 | #154 | Good 47.2% |
| Kenyans | 70.6 /100 | #155 | Good 47.1% |
| South Americans | 70.5 /100 | #156 | Good 47.1% |
| Sudanese | 70.3 /100 | #157 | Good 47.1% |
| Immigrants | Germany | 69.7 /100 | #158 | Good 47.1% |
| Immigrants | Poland | 69.2 /100 | #159 | Good 47.1% |
Demographics Similar to Shoshone by Associate's Degree
In terms of associate's degree, the demographic groups most similar to Shoshone are Immigrants from El Salvador (38.4%, a difference of 0.040%), Immigrants from Honduras (38.5%, a difference of 0.070%), Sioux (38.5%, a difference of 0.13%), Guatemalan (38.5%, a difference of 0.19%), and Colville (38.5%, a difference of 0.27%).
| Demographics | Rating | Rank | Associate's Degree |
| Ute | 0.0 /100 | #299 | Tragic 38.6% |
| Chickasaw | 0.0 /100 | #300 | Tragic 38.6% |
| Tsimshian | 0.0 /100 | #301 | Tragic 38.6% |
| Colville | 0.0 /100 | #302 | Tragic 38.5% |
| Guatemalans | 0.0 /100 | #303 | Tragic 38.5% |
| Sioux | 0.0 /100 | #304 | Tragic 38.5% |
| Immigrants | Honduras | 0.0 /100 | #305 | Tragic 38.5% |
| Shoshone | 0.0 /100 | #306 | Tragic 38.4% |
| Immigrants | El Salvador | 0.0 /100 | #307 | Tragic 38.4% |
| Mexican American Indians | 0.0 /100 | #308 | Tragic 38.2% |
| Immigrants | Guatemala | 0.0 /100 | #309 | Tragic 38.1% |
| Immigrants | Dominican Republic | 0.0 /100 | #310 | Tragic 37.9% |
| Immigrants | Latin America | 0.0 /100 | #311 | Tragic 37.9% |
| Choctaw | 0.0 /100 | #312 | Tragic 37.8% |
| Hispanics or Latinos | 0.0 /100 | #313 | Tragic 37.7% |