Immigrants from Afghanistan vs Latvian Male Unemployment
COMPARE
Immigrants from Afghanistan
Latvian
Male Unemployment
Male Unemployment Comparison
Immigrants from Afghanistan
Latvians
5.3%
MALE UNEMPLOYMENT
37.9/ 100
METRIC RATING
181st/ 347
METRIC RANK
4.8%
MALE UNEMPLOYMENT
99.7/ 100
METRIC RATING
33rd/ 347
METRIC RANK
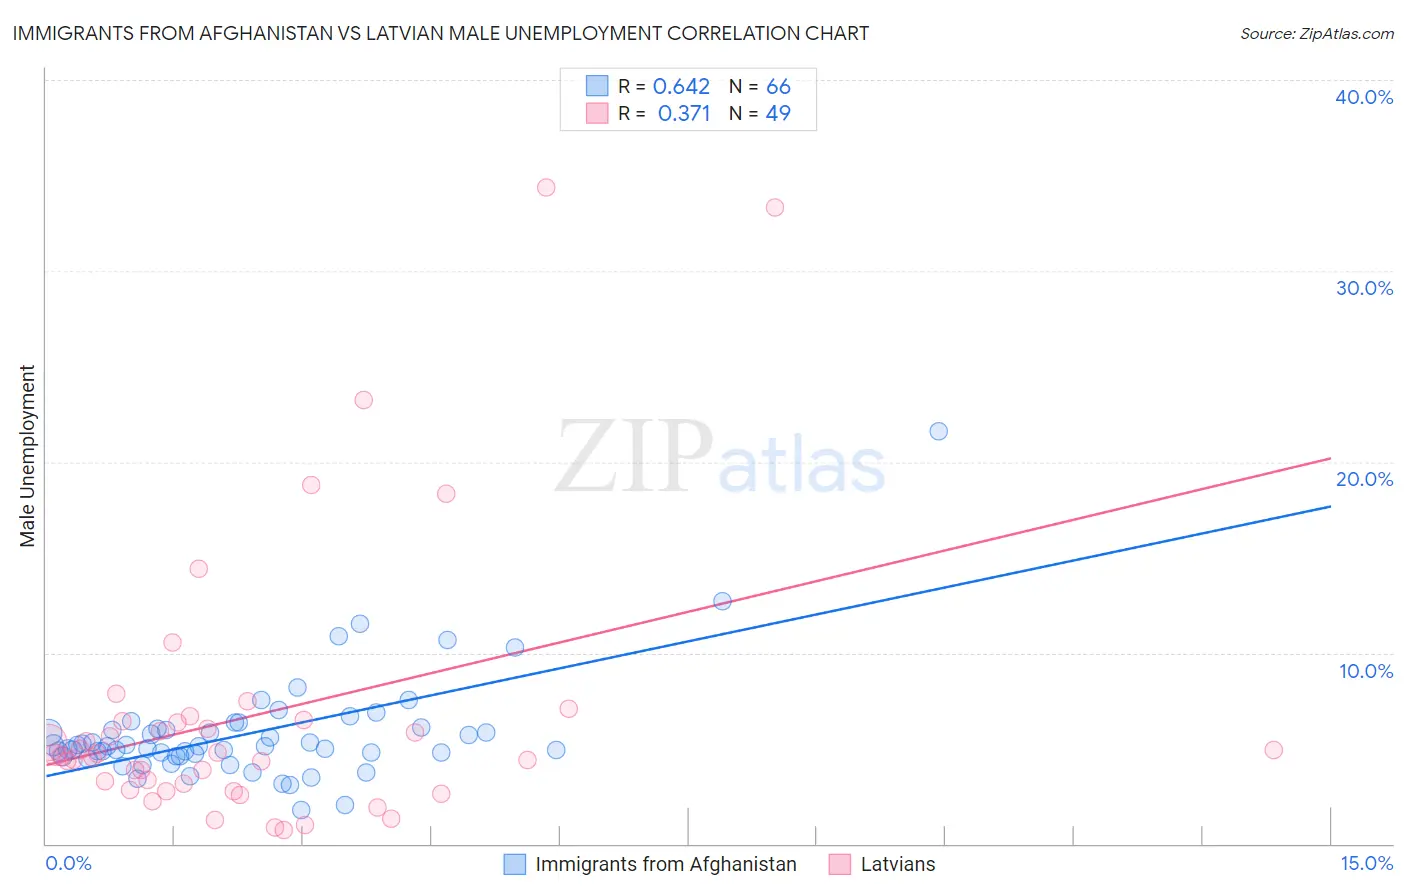
Immigrants from Afghanistan vs Latvian Male Unemployment Correlation Chart
The statistical analysis conducted on geographies consisting of 147,586,191 people shows a significant positive correlation between the proportion of Immigrants from Afghanistan and unemployment rate among males in the United States with a correlation coefficient (R) of 0.642 and weighted average of 5.3%. Similarly, the statistical analysis conducted on geographies consisting of 220,207,220 people shows a mild positive correlation between the proportion of Latvians and unemployment rate among males in the United States with a correlation coefficient (R) of 0.371 and weighted average of 4.8%, a difference of 10.1%.
Male Unemployment Correlation Summary
| Measurement | Immigrants from Afghanistan | Latvian |
| Minimum | 1.8% | 0.70% |
| Maximum | 21.6% | 34.4% |
| Range | 19.8% | 33.7% |
| Mean | 5.8% | 6.7% |
| Median | 5.1% | 4.7% |
| Interquartile 25% (IQ1) | 4.6% | 3.0% |
| Interquartile 75% (IQ3) | 6.0% | 6.5% |
| Interquartile Range (IQR) | 1.4% | 3.5% |
| Standard Deviation (Sample) | 2.8% | 7.2% |
| Standard Deviation (Population) | 2.8% | 7.2% |
Similar Demographics by Male Unemployment
Demographics Similar to Immigrants from Afghanistan by Male Unemployment
In terms of male unemployment, the demographic groups most similar to Immigrants from Afghanistan are Potawatomi (5.3%, a difference of 0.010%), Taiwanese (5.3%, a difference of 0.020%), Malaysian (5.3%, a difference of 0.10%), Immigrants from Oceania (5.3%, a difference of 0.18%), and Spaniard (5.3%, a difference of 0.18%).
| Demographics | Rating | Rank | Male Unemployment |
| Immigrants | Iran | 50.0 /100 | #174 | Average 5.3% |
| Immigrants | Iraq | 48.1 /100 | #175 | Average 5.3% |
| Immigrants | Poland | 46.0 /100 | #176 | Average 5.3% |
| Immigrants | Peru | 44.6 /100 | #177 | Average 5.3% |
| Osage | 42.5 /100 | #178 | Average 5.3% |
| Immigrants | Oceania | 40.8 /100 | #179 | Average 5.3% |
| Malaysians | 39.6 /100 | #180 | Fair 5.3% |
| Immigrants | Afghanistan | 37.9 /100 | #181 | Fair 5.3% |
| Potawatomi | 37.8 /100 | #182 | Fair 5.3% |
| Taiwanese | 37.6 /100 | #183 | Fair 5.3% |
| Spaniards | 35.1 /100 | #184 | Fair 5.3% |
| Koreans | 34.9 /100 | #185 | Fair 5.3% |
| Iraqis | 31.6 /100 | #186 | Fair 5.4% |
| Costa Ricans | 31.3 /100 | #187 | Fair 5.4% |
| Arabs | 30.2 /100 | #188 | Fair 5.4% |
Demographics Similar to Latvians by Male Unemployment
In terms of male unemployment, the demographic groups most similar to Latvians are Welsh (4.8%, a difference of 0.080%), Immigrants from Nepal (4.8%, a difference of 0.30%), Sudanese (4.8%, a difference of 0.31%), British (4.8%, a difference of 0.56%), and Scottish (4.8%, a difference of 0.88%).
| Demographics | Rating | Rank | Male Unemployment |
| Dutch | 99.9 /100 | #26 | Exceptional 4.8% |
| Belgians | 99.9 /100 | #27 | Exceptional 4.8% |
| Bulgarians | 99.8 /100 | #28 | Exceptional 4.8% |
| Scottish | 99.8 /100 | #29 | Exceptional 4.8% |
| British | 99.8 /100 | #30 | Exceptional 4.8% |
| Sudanese | 99.8 /100 | #31 | Exceptional 4.8% |
| Immigrants | Nepal | 99.8 /100 | #32 | Exceptional 4.8% |
| Latvians | 99.7 /100 | #33 | Exceptional 4.8% |
| Welsh | 99.7 /100 | #34 | Exceptional 4.8% |
| Paraguayans | 99.5 /100 | #35 | Exceptional 4.9% |
| Immigrants | Singapore | 99.4 /100 | #36 | Exceptional 4.9% |
| Scotch-Irish | 99.4 /100 | #37 | Exceptional 4.9% |
| Immigrants | Bosnia and Herzegovina | 99.4 /100 | #38 | Exceptional 4.9% |
| Burmese | 99.3 /100 | #39 | Exceptional 4.9% |
| Northern Europeans | 99.3 /100 | #40 | Exceptional 4.9% |