Icelander vs Creek Master's Degree
COMPARE
Icelander
Creek
Master's Degree
Master's Degree Comparison
Icelanders
Creek
15.5%
MASTER'S DEGREE
76.8/ 100
METRIC RATING
153rd/ 347
METRIC RANK
10.5%
MASTER'S DEGREE
0.0/ 100
METRIC RATING
326th/ 347
METRIC RANK
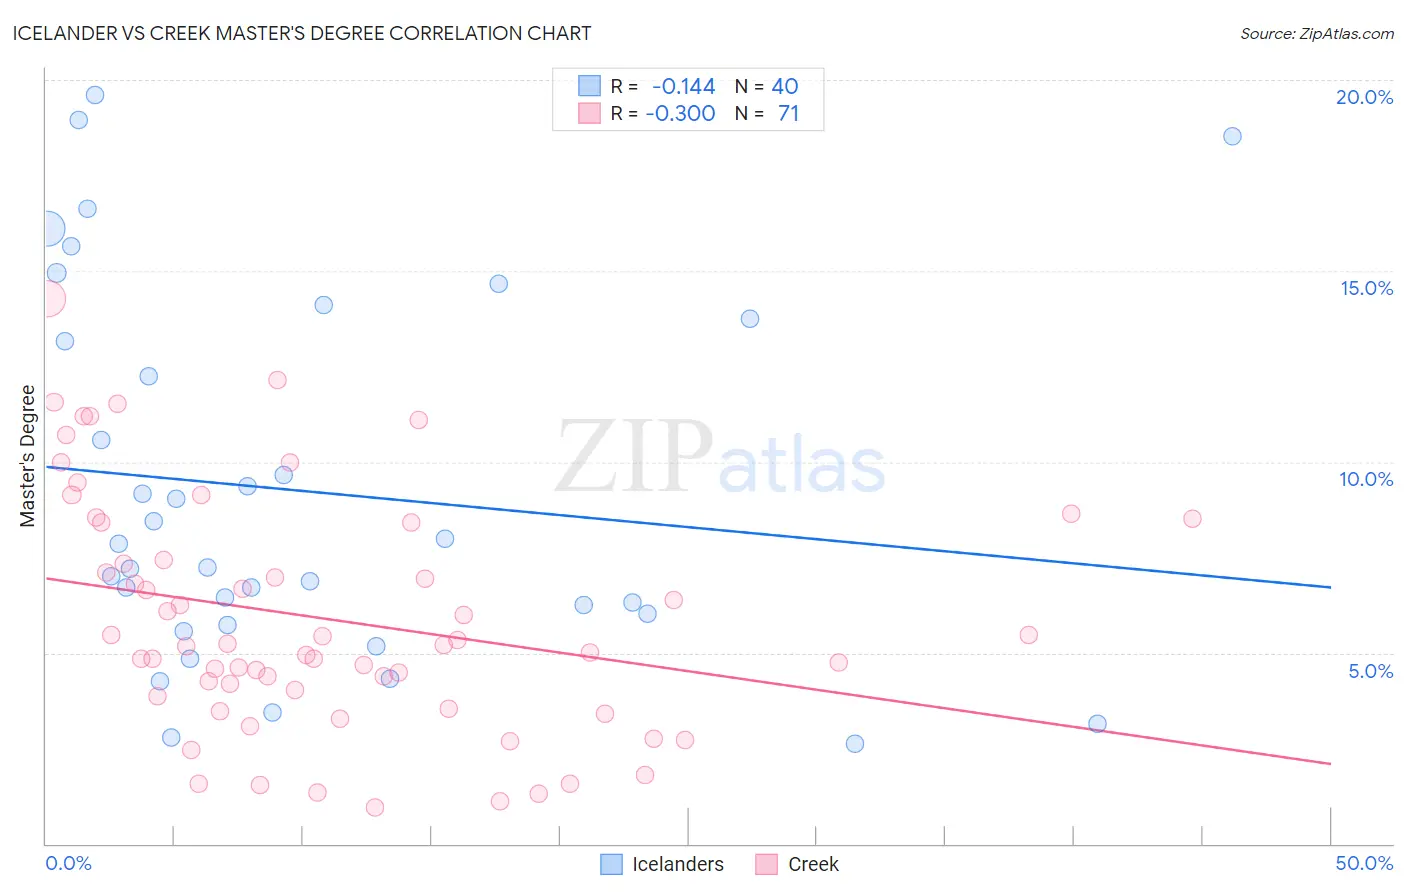
Icelander vs Creek Master's Degree Correlation Chart
The statistical analysis conducted on geographies consisting of 159,641,316 people shows a poor negative correlation between the proportion of Icelanders and percentage of population with at least master's degree education in the United States with a correlation coefficient (R) of -0.144 and weighted average of 15.5%. Similarly, the statistical analysis conducted on geographies consisting of 178,384,928 people shows a weak negative correlation between the proportion of Creek and percentage of population with at least master's degree education in the United States with a correlation coefficient (R) of -0.300 and weighted average of 10.5%, a difference of 47.4%.
Master's Degree Correlation Summary
| Measurement | Icelander | Creek |
| Minimum | 2.6% | 0.96% |
| Maximum | 19.6% | 14.3% |
| Range | 17.0% | 13.3% |
| Mean | 9.2% | 5.9% |
| Median | 7.6% | 5.2% |
| Interquartile 25% (IQ1) | 5.9% | 3.9% |
| Interquartile 75% (IQ3) | 13.5% | 8.4% |
| Interquartile Range (IQR) | 7.6% | 4.5% |
| Standard Deviation (Sample) | 4.8% | 3.1% |
| Standard Deviation (Population) | 4.7% | 3.1% |
Similar Demographics by Master's Degree
Demographics Similar to Icelanders by Master's Degree
In terms of master's degree, the demographic groups most similar to Icelanders are Slavic (15.5%, a difference of 0.030%), Iraqi (15.5%, a difference of 0.080%), Immigrants from South America (15.5%, a difference of 0.090%), Immigrants from Bangladesh (15.5%, a difference of 0.13%), and Slovene (15.5%, a difference of 0.20%).
| Demographics | Rating | Rank | Master's Degree |
| Immigrants | Afghanistan | 79.4 /100 | #146 | Good 15.6% |
| Hungarians | 79.1 /100 | #147 | Good 15.6% |
| Immigrants | Senegal | 78.2 /100 | #148 | Good 15.5% |
| Ghanaians | 78.2 /100 | #149 | Good 15.5% |
| Slovenes | 78.0 /100 | #150 | Good 15.5% |
| Iraqis | 77.3 /100 | #151 | Good 15.5% |
| Slavs | 77.0 /100 | #152 | Good 15.5% |
| Icelanders | 76.8 /100 | #153 | Good 15.5% |
| Immigrants | South America | 76.3 /100 | #154 | Good 15.5% |
| Immigrants | Bangladesh | 76.1 /100 | #155 | Good 15.5% |
| Bermudans | 73.9 /100 | #156 | Good 15.4% |
| Immigrants | Cameroon | 71.7 /100 | #157 | Good 15.4% |
| Immigrants | Poland | 71.5 /100 | #158 | Good 15.4% |
| Luxembourgers | 71.0 /100 | #159 | Good 15.3% |
| Kenyans | 70.3 /100 | #160 | Good 15.3% |
Demographics Similar to Creek by Master's Degree
In terms of master's degree, the demographic groups most similar to Creek are Inupiat (10.5%, a difference of 0.0%), Paiute (10.5%, a difference of 0.18%), Bangladeshi (10.5%, a difference of 0.32%), Nepalese (10.5%, a difference of 0.40%), and Dutch West Indian (10.6%, a difference of 1.1%).
| Demographics | Rating | Rank | Master's Degree |
| Kiowa | 0.0 /100 | #319 | Tragic 10.8% |
| Immigrants | Micronesia | 0.0 /100 | #320 | Tragic 10.8% |
| Pennsylvania Germans | 0.0 /100 | #321 | Tragic 10.7% |
| Sioux | 0.0 /100 | #322 | Tragic 10.7% |
| Crow | 0.0 /100 | #323 | Tragic 10.6% |
| Dutch West Indians | 0.0 /100 | #324 | Tragic 10.6% |
| Inupiat | 0.0 /100 | #325 | Tragic 10.5% |
| Creek | 0.0 /100 | #326 | Tragic 10.5% |
| Paiute | 0.0 /100 | #327 | Tragic 10.5% |
| Bangladeshis | 0.0 /100 | #328 | Tragic 10.5% |
| Nepalese | 0.0 /100 | #329 | Tragic 10.5% |
| Fijians | 0.0 /100 | #330 | Tragic 10.3% |
| Pueblo | 0.0 /100 | #331 | Tragic 10.3% |
| Immigrants | Azores | 0.0 /100 | #332 | Tragic 10.2% |
| Menominee | 0.0 /100 | #333 | Tragic 10.2% |