Icelander vs Scandinavian In Labor Force | Age 25-29
COMPARE
Icelander
Scandinavian
In Labor Force | Age 25-29
In Labor Force | Age 25-29 Comparison
Icelanders
Scandinavians
84.8%
IN LABOR FORCE | AGE 25-29
68.2/ 100
METRIC RATING
146th/ 347
METRIC RANK
84.9%
IN LABOR FORCE | AGE 25-29
85.1/ 100
METRIC RATING
122nd/ 347
METRIC RANK
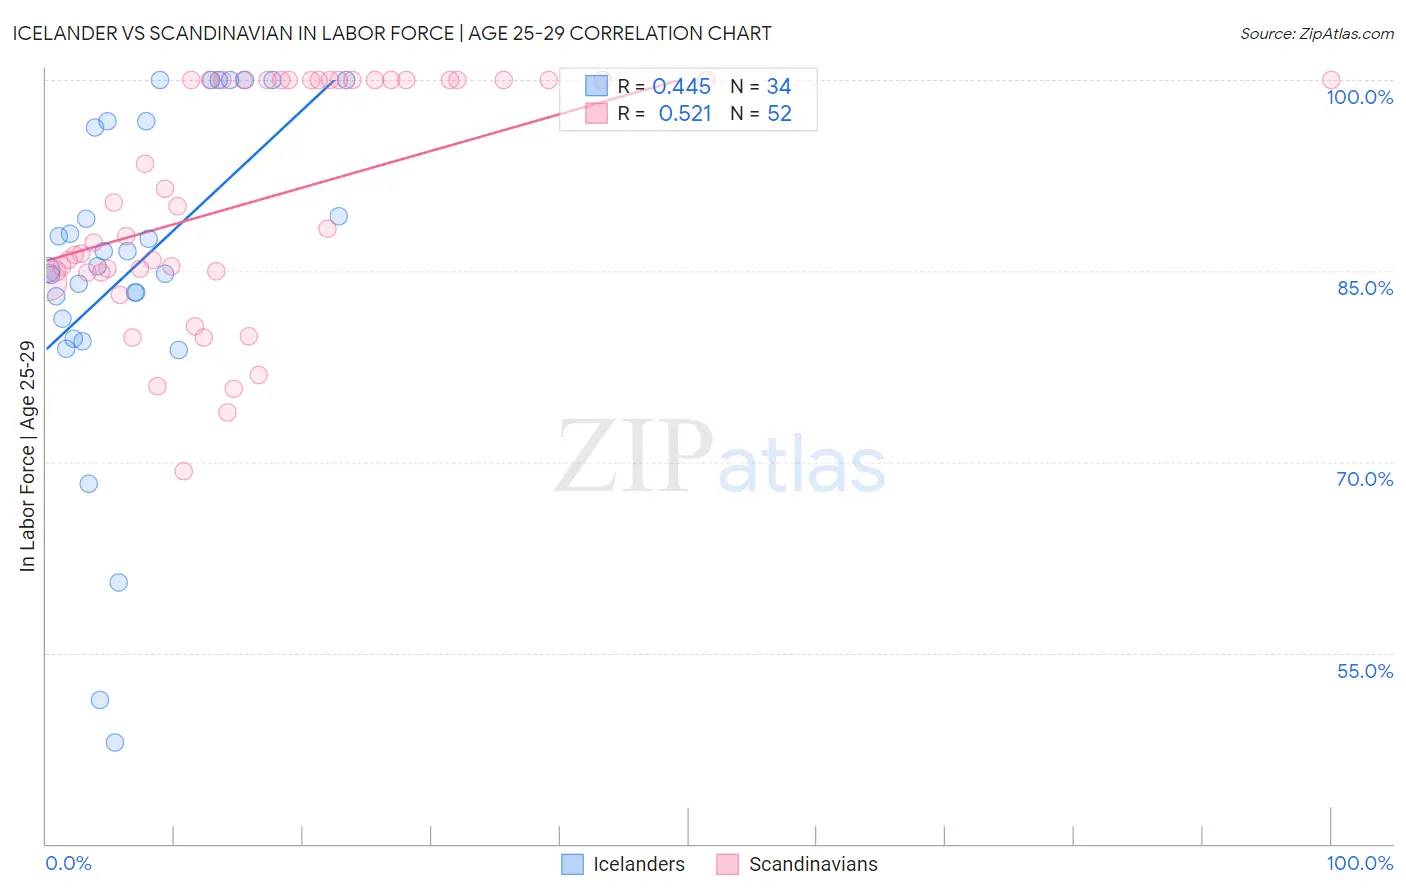
Icelander vs Scandinavian In Labor Force | Age 25-29 Correlation Chart
The statistical analysis conducted on geographies consisting of 159,638,319 people shows a moderate positive correlation between the proportion of Icelanders and labor force participation rate among population between the ages 25 and 29 in the United States with a correlation coefficient (R) of 0.445 and weighted average of 84.8%. Similarly, the statistical analysis conducted on geographies consisting of 472,219,125 people shows a substantial positive correlation between the proportion of Scandinavians and labor force participation rate among population between the ages 25 and 29 in the United States with a correlation coefficient (R) of 0.521 and weighted average of 84.9%, a difference of 0.18%.
In Labor Force | Age 25-29 Correlation Summary
| Measurement | Icelander | Scandinavian |
| Minimum | 48.0% | 69.3% |
| Maximum | 100.0% | 100.0% |
| Range | 52.0% | 30.7% |
| Mean | 85.4% | 90.6% |
| Median | 85.9% | 89.2% |
| Interquartile 25% (IQ1) | 81.2% | 85.0% |
| Interquartile 75% (IQ3) | 96.7% | 100.0% |
| Interquartile Range (IQR) | 15.5% | 15.0% |
| Standard Deviation (Sample) | 13.0% | 9.1% |
| Standard Deviation (Population) | 12.8% | 9.0% |
Similar Demographics by In Labor Force | Age 25-29
Demographics Similar to Icelanders by In Labor Force | Age 25-29
In terms of in labor force | age 25-29, the demographic groups most similar to Icelanders are Immigrants from Senegal (84.8%, a difference of 0.0%), Immigrants from Asia (84.8%, a difference of 0.0%), Sri Lankan (84.8%, a difference of 0.010%), Immigrants from Laos (84.8%, a difference of 0.010%), and Pakistani (84.8%, a difference of 0.020%).
| Demographics | Rating | Rank | In Labor Force | Age 25-29 |
| Immigrants | Eastern Asia | 72.6 /100 | #139 | Good 84.8% |
| Immigrants | North America | 72.1 /100 | #140 | Good 84.8% |
| Danes | 71.9 /100 | #141 | Good 84.8% |
| Pakistanis | 70.0 /100 | #142 | Good 84.8% |
| Sri Lankans | 69.2 /100 | #143 | Good 84.8% |
| Immigrants | Laos | 69.0 /100 | #144 | Good 84.8% |
| Immigrants | Senegal | 68.3 /100 | #145 | Good 84.8% |
| Icelanders | 68.2 /100 | #146 | Good 84.8% |
| Immigrants | Asia | 68.2 /100 | #147 | Good 84.8% |
| Immigrants | England | 65.2 /100 | #148 | Good 84.7% |
| Peruvians | 64.7 /100 | #149 | Good 84.7% |
| Swiss | 64.7 /100 | #150 | Good 84.7% |
| Colombians | 62.8 /100 | #151 | Good 84.7% |
| Immigrants | Pakistan | 62.7 /100 | #152 | Good 84.7% |
| Immigrants | Taiwan | 62.2 /100 | #153 | Good 84.7% |
Demographics Similar to Scandinavians by In Labor Force | Age 25-29
In terms of in labor force | age 25-29, the demographic groups most similar to Scandinavians are Dutch (84.9%, a difference of 0.0%), Immigrants from Iran (84.9%, a difference of 0.0%), Immigrants from South Africa (84.9%, a difference of 0.010%), Immigrants from Chile (84.9%, a difference of 0.010%), and Uruguayan (84.9%, a difference of 0.010%).
| Demographics | Rating | Rank | In Labor Force | Age 25-29 |
| South Africans | 88.9 /100 | #115 | Excellent 85.0% |
| Chileans | 88.8 /100 | #116 | Excellent 85.0% |
| Immigrants | Belarus | 88.0 /100 | #117 | Excellent 85.0% |
| Finns | 87.8 /100 | #118 | Excellent 85.0% |
| Filipinos | 87.1 /100 | #119 | Excellent 84.9% |
| Immigrants | South Africa | 86.1 /100 | #120 | Excellent 84.9% |
| Immigrants | Chile | 85.6 /100 | #121 | Excellent 84.9% |
| Scandinavians | 85.1 /100 | #122 | Excellent 84.9% |
| Dutch | 84.9 /100 | #123 | Excellent 84.9% |
| Immigrants | Iran | 84.8 /100 | #124 | Excellent 84.9% |
| Uruguayans | 84.7 /100 | #125 | Excellent 84.9% |
| Immigrants | Singapore | 84.4 /100 | #126 | Excellent 84.9% |
| Immigrants | Uruguay | 84.0 /100 | #127 | Excellent 84.9% |
| Australians | 83.6 /100 | #128 | Excellent 84.9% |
| Immigrants | Russia | 81.6 /100 | #129 | Excellent 84.9% |