Icelander vs German Master's Degree
COMPARE
Icelander
German
Master's Degree
Master's Degree Comparison
Icelanders
Germans
15.5%
MASTER'S DEGREE
76.8/ 100
METRIC RATING
153rd/ 347
METRIC RANK
14.0%
MASTER'S DEGREE
13.1/ 100
METRIC RATING
220th/ 347
METRIC RANK
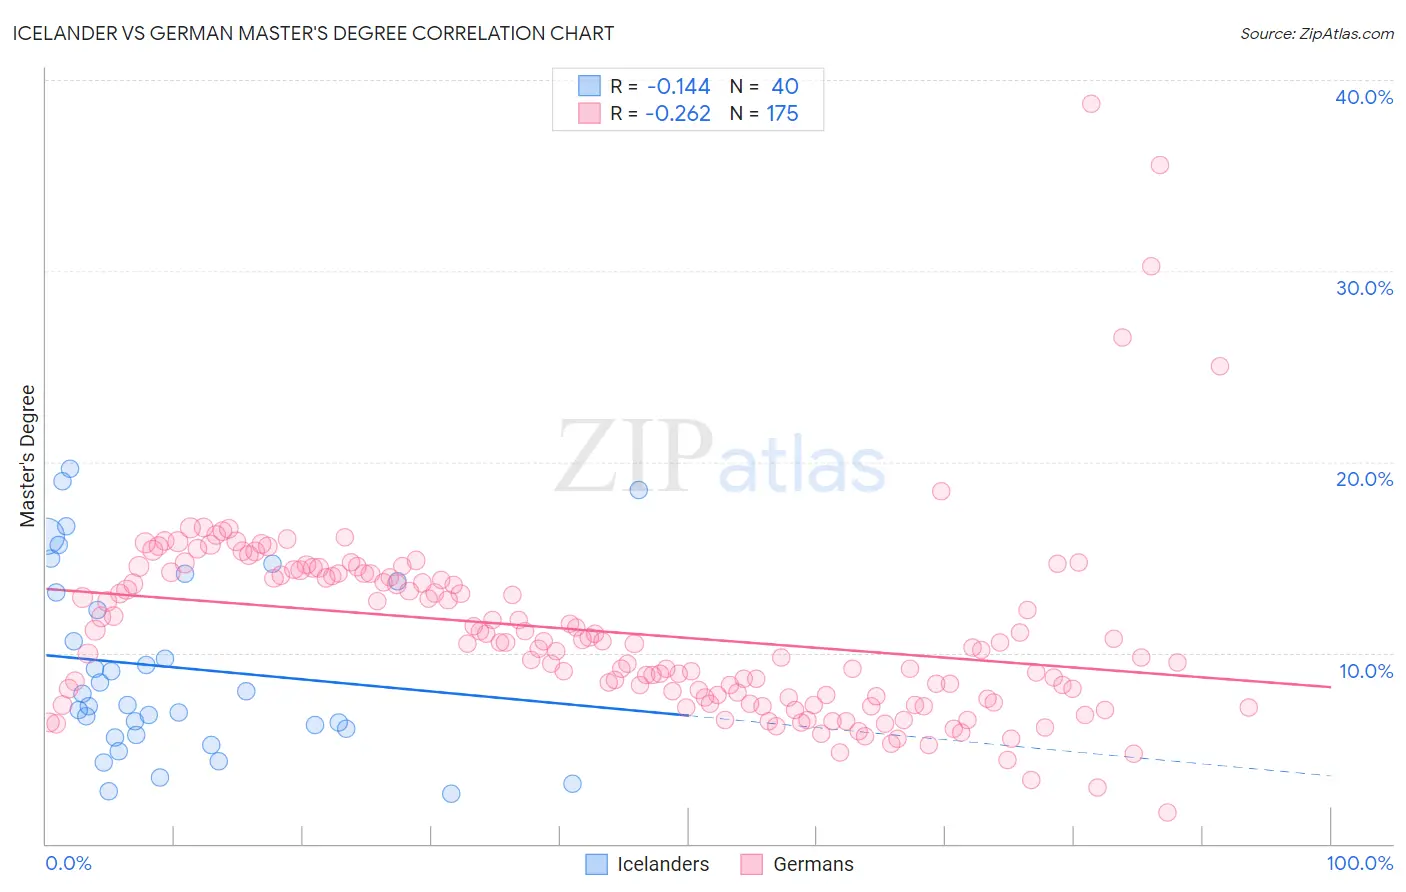
Icelander vs German Master's Degree Correlation Chart
The statistical analysis conducted on geographies consisting of 159,641,316 people shows a poor negative correlation between the proportion of Icelanders and percentage of population with at least master's degree education in the United States with a correlation coefficient (R) of -0.144 and weighted average of 15.5%. Similarly, the statistical analysis conducted on geographies consisting of 579,621,104 people shows a weak negative correlation between the proportion of Germans and percentage of population with at least master's degree education in the United States with a correlation coefficient (R) of -0.262 and weighted average of 14.0%, a difference of 10.5%.
Master's Degree Correlation Summary
| Measurement | Icelander | German |
| Minimum | 2.6% | 1.7% |
| Maximum | 19.6% | 38.7% |
| Range | 17.0% | 37.1% |
| Mean | 9.2% | 11.1% |
| Median | 7.6% | 10.5% |
| Interquartile 25% (IQ1) | 5.9% | 7.6% |
| Interquartile 75% (IQ3) | 13.5% | 14.0% |
| Interquartile Range (IQR) | 7.6% | 6.4% |
| Standard Deviation (Sample) | 4.8% | 5.0% |
| Standard Deviation (Population) | 4.7% | 5.0% |
Similar Demographics by Master's Degree
Demographics Similar to Icelanders by Master's Degree
In terms of master's degree, the demographic groups most similar to Icelanders are Slavic (15.5%, a difference of 0.030%), Iraqi (15.5%, a difference of 0.080%), Immigrants from South America (15.5%, a difference of 0.090%), Immigrants from Bangladesh (15.5%, a difference of 0.13%), and Slovene (15.5%, a difference of 0.20%).
| Demographics | Rating | Rank | Master's Degree |
| Immigrants | Afghanistan | 79.4 /100 | #146 | Good 15.6% |
| Hungarians | 79.1 /100 | #147 | Good 15.6% |
| Immigrants | Senegal | 78.2 /100 | #148 | Good 15.5% |
| Ghanaians | 78.2 /100 | #149 | Good 15.5% |
| Slovenes | 78.0 /100 | #150 | Good 15.5% |
| Iraqis | 77.3 /100 | #151 | Good 15.5% |
| Slavs | 77.0 /100 | #152 | Good 15.5% |
| Icelanders | 76.8 /100 | #153 | Good 15.5% |
| Immigrants | South America | 76.3 /100 | #154 | Good 15.5% |
| Immigrants | Bangladesh | 76.1 /100 | #155 | Good 15.5% |
| Bermudans | 73.9 /100 | #156 | Good 15.4% |
| Immigrants | Cameroon | 71.7 /100 | #157 | Good 15.4% |
| Immigrants | Poland | 71.5 /100 | #158 | Good 15.4% |
| Luxembourgers | 71.0 /100 | #159 | Good 15.3% |
| Kenyans | 70.3 /100 | #160 | Good 15.3% |
Demographics Similar to Germans by Master's Degree
In terms of master's degree, the demographic groups most similar to Germans are Korean (14.0%, a difference of 0.13%), Norwegian (14.0%, a difference of 0.15%), Ecuadorian (14.0%, a difference of 0.17%), Immigrants from South Eastern Asia (14.0%, a difference of 0.37%), and Immigrants from Grenada (14.0%, a difference of 0.41%).
| Demographics | Rating | Rank | Master's Degree |
| Immigrants | Thailand | 17.0 /100 | #213 | Poor 14.2% |
| Finns | 16.9 /100 | #214 | Poor 14.2% |
| Immigrants | Vietnam | 16.1 /100 | #215 | Poor 14.1% |
| Immigrants | Somalia | 15.8 /100 | #216 | Poor 14.1% |
| Immigrants | Trinidad and Tobago | 15.8 /100 | #217 | Poor 14.1% |
| French Canadians | 14.9 /100 | #218 | Poor 14.1% |
| Norwegians | 13.6 /100 | #219 | Poor 14.0% |
| Germans | 13.1 /100 | #220 | Poor 14.0% |
| Koreans | 12.7 /100 | #221 | Poor 14.0% |
| Ecuadorians | 12.6 /100 | #222 | Poor 14.0% |
| Immigrants | South Eastern Asia | 11.9 /100 | #223 | Poor 14.0% |
| Immigrants | Grenada | 11.8 /100 | #224 | Poor 14.0% |
| Portuguese | 11.2 /100 | #225 | Poor 13.9% |
| Immigrants | St. Vincent and the Grenadines | 11.0 /100 | #226 | Poor 13.9% |
| Immigrants | West Indies | 9.8 /100 | #227 | Tragic 13.9% |