Icelander vs Burmese Master's Degree
COMPARE
Icelander
Burmese
Master's Degree
Master's Degree Comparison
Icelanders
Burmese
15.5%
MASTER'S DEGREE
76.8/ 100
METRIC RATING
153rd/ 347
METRIC RANK
19.7%
MASTER'S DEGREE
100.0/ 100
METRIC RATING
32nd/ 347
METRIC RANK
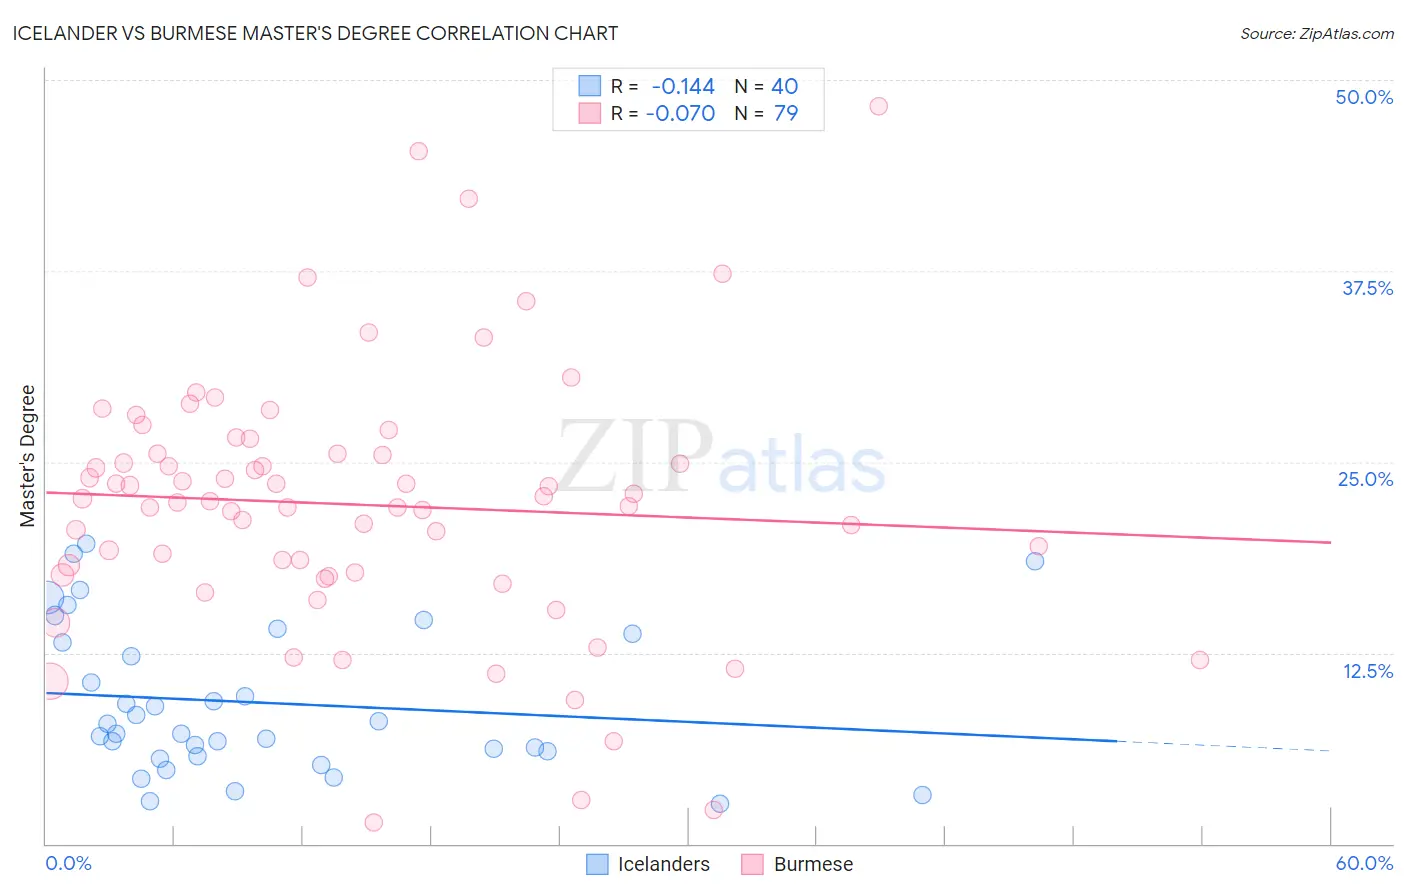
Icelander vs Burmese Master's Degree Correlation Chart
The statistical analysis conducted on geographies consisting of 159,641,316 people shows a poor negative correlation between the proportion of Icelanders and percentage of population with at least master's degree education in the United States with a correlation coefficient (R) of -0.144 and weighted average of 15.5%. Similarly, the statistical analysis conducted on geographies consisting of 465,142,202 people shows a slight negative correlation between the proportion of Burmese and percentage of population with at least master's degree education in the United States with a correlation coefficient (R) of -0.070 and weighted average of 19.7%, a difference of 27.2%.
Master's Degree Correlation Summary
| Measurement | Icelander | Burmese |
| Minimum | 2.6% | 1.4% |
| Maximum | 19.6% | 48.2% |
| Range | 17.0% | 46.8% |
| Mean | 9.2% | 22.2% |
| Median | 7.6% | 22.5% |
| Interquartile 25% (IQ1) | 5.9% | 17.6% |
| Interquartile 75% (IQ3) | 13.5% | 25.5% |
| Interquartile Range (IQR) | 7.6% | 8.0% |
| Standard Deviation (Sample) | 4.8% | 8.6% |
| Standard Deviation (Population) | 4.7% | 8.5% |
Similar Demographics by Master's Degree
Demographics Similar to Icelanders by Master's Degree
In terms of master's degree, the demographic groups most similar to Icelanders are Slavic (15.5%, a difference of 0.030%), Iraqi (15.5%, a difference of 0.080%), Immigrants from South America (15.5%, a difference of 0.090%), Immigrants from Bangladesh (15.5%, a difference of 0.13%), and Slovene (15.5%, a difference of 0.20%).
| Demographics | Rating | Rank | Master's Degree |
| Immigrants | Afghanistan | 79.4 /100 | #146 | Good 15.6% |
| Hungarians | 79.1 /100 | #147 | Good 15.6% |
| Immigrants | Senegal | 78.2 /100 | #148 | Good 15.5% |
| Ghanaians | 78.2 /100 | #149 | Good 15.5% |
| Slovenes | 78.0 /100 | #150 | Good 15.5% |
| Iraqis | 77.3 /100 | #151 | Good 15.5% |
| Slavs | 77.0 /100 | #152 | Good 15.5% |
| Icelanders | 76.8 /100 | #153 | Good 15.5% |
| Immigrants | South America | 76.3 /100 | #154 | Good 15.5% |
| Immigrants | Bangladesh | 76.1 /100 | #155 | Good 15.5% |
| Bermudans | 73.9 /100 | #156 | Good 15.4% |
| Immigrants | Cameroon | 71.7 /100 | #157 | Good 15.4% |
| Immigrants | Poland | 71.5 /100 | #158 | Good 15.4% |
| Luxembourgers | 71.0 /100 | #159 | Good 15.3% |
| Kenyans | 70.3 /100 | #160 | Good 15.3% |
Demographics Similar to Burmese by Master's Degree
In terms of master's degree, the demographic groups most similar to Burmese are Immigrants from Korea (19.7%, a difference of 0.070%), Immigrants from Turkey (19.7%, a difference of 0.080%), Latvian (19.8%, a difference of 0.58%), Russian (19.5%, a difference of 0.79%), and Immigrants from Denmark (19.5%, a difference of 0.81%).
| Demographics | Rating | Rank | Master's Degree |
| Immigrants | Japan | 100.0 /100 | #25 | Exceptional 20.0% |
| Cambodians | 100.0 /100 | #26 | Exceptional 20.0% |
| Immigrants | Sri Lanka | 100.0 /100 | #27 | Exceptional 19.9% |
| Turks | 100.0 /100 | #28 | Exceptional 19.9% |
| Latvians | 100.0 /100 | #29 | Exceptional 19.8% |
| Immigrants | Turkey | 100.0 /100 | #30 | Exceptional 19.7% |
| Immigrants | Korea | 100.0 /100 | #31 | Exceptional 19.7% |
| Burmese | 100.0 /100 | #32 | Exceptional 19.7% |
| Russians | 100.0 /100 | #33 | Exceptional 19.5% |
| Immigrants | Denmark | 100.0 /100 | #34 | Exceptional 19.5% |
| Immigrants | Northern Europe | 100.0 /100 | #35 | Exceptional 19.5% |
| Immigrants | Russia | 100.0 /100 | #36 | Exceptional 19.4% |
| Mongolians | 100.0 /100 | #37 | Exceptional 19.4% |
| Bolivians | 100.0 /100 | #38 | Exceptional 19.3% |
| Immigrants | Spain | 100.0 /100 | #39 | Exceptional 19.1% |