Icelander vs Macedonian Master's Degree
COMPARE
Icelander
Macedonian
Master's Degree
Master's Degree Comparison
Icelanders
Macedonians
15.5%
MASTER'S DEGREE
76.8/ 100
METRIC RATING
153rd/ 347
METRIC RANK
16.7%
MASTER'S DEGREE
97.7/ 100
METRIC RATING
112th/ 347
METRIC RANK
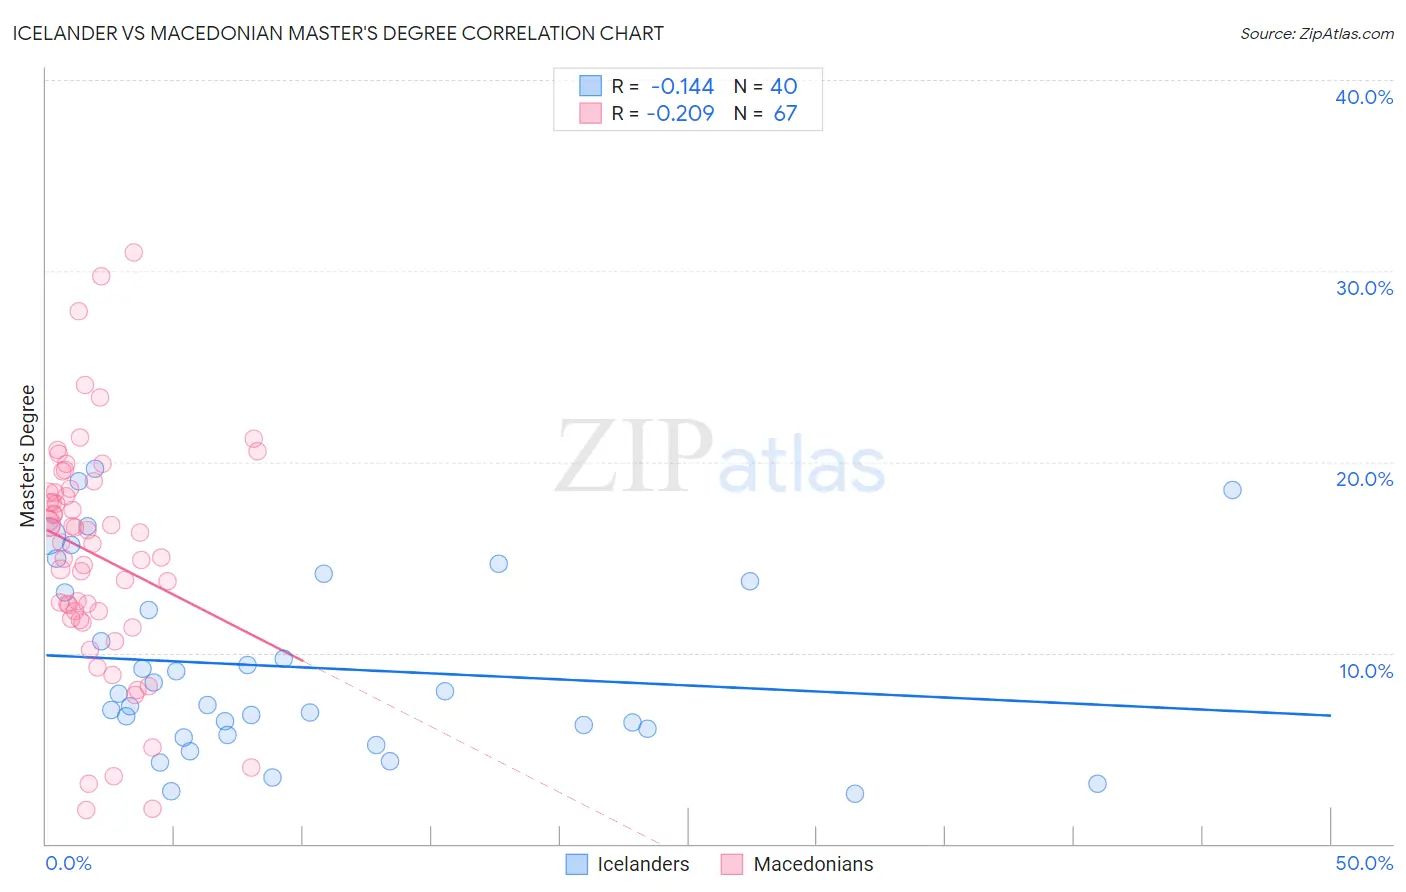
Icelander vs Macedonian Master's Degree Correlation Chart
The statistical analysis conducted on geographies consisting of 159,641,316 people shows a poor negative correlation between the proportion of Icelanders and percentage of population with at least master's degree education in the United States with a correlation coefficient (R) of -0.144 and weighted average of 15.5%. Similarly, the statistical analysis conducted on geographies consisting of 132,580,615 people shows a weak negative correlation between the proportion of Macedonians and percentage of population with at least master's degree education in the United States with a correlation coefficient (R) of -0.209 and weighted average of 16.7%, a difference of 7.8%.
Master's Degree Correlation Summary
| Measurement | Icelander | Macedonian |
| Minimum | 2.6% | 1.8% |
| Maximum | 19.6% | 31.0% |
| Range | 17.0% | 29.2% |
| Mean | 9.2% | 15.1% |
| Median | 7.6% | 15.8% |
| Interquartile 25% (IQ1) | 5.9% | 11.8% |
| Interquartile 75% (IQ3) | 13.5% | 18.4% |
| Interquartile Range (IQR) | 7.6% | 6.6% |
| Standard Deviation (Sample) | 4.8% | 6.0% |
| Standard Deviation (Population) | 4.7% | 5.9% |
Similar Demographics by Master's Degree
Demographics Similar to Icelanders by Master's Degree
In terms of master's degree, the demographic groups most similar to Icelanders are Slavic (15.5%, a difference of 0.030%), Iraqi (15.5%, a difference of 0.080%), Immigrants from South America (15.5%, a difference of 0.090%), Immigrants from Bangladesh (15.5%, a difference of 0.13%), and Slovene (15.5%, a difference of 0.20%).
| Demographics | Rating | Rank | Master's Degree |
| Immigrants | Afghanistan | 79.4 /100 | #146 | Good 15.6% |
| Hungarians | 79.1 /100 | #147 | Good 15.6% |
| Immigrants | Senegal | 78.2 /100 | #148 | Good 15.5% |
| Ghanaians | 78.2 /100 | #149 | Good 15.5% |
| Slovenes | 78.0 /100 | #150 | Good 15.5% |
| Iraqis | 77.3 /100 | #151 | Good 15.5% |
| Slavs | 77.0 /100 | #152 | Good 15.5% |
| Icelanders | 76.8 /100 | #153 | Good 15.5% |
| Immigrants | South America | 76.3 /100 | #154 | Good 15.5% |
| Immigrants | Bangladesh | 76.1 /100 | #155 | Good 15.5% |
| Bermudans | 73.9 /100 | #156 | Good 15.4% |
| Immigrants | Cameroon | 71.7 /100 | #157 | Good 15.4% |
| Immigrants | Poland | 71.5 /100 | #158 | Good 15.4% |
| Luxembourgers | 71.0 /100 | #159 | Good 15.3% |
| Kenyans | 70.3 /100 | #160 | Good 15.3% |
Demographics Similar to Macedonians by Master's Degree
In terms of master's degree, the demographic groups most similar to Macedonians are Arab (16.7%, a difference of 0.010%), Northern European (16.7%, a difference of 0.080%), Austrian (16.7%, a difference of 0.14%), Immigrants from Uganda (16.6%, a difference of 0.38%), and Immigrants from Chile (16.8%, a difference of 0.41%).
| Demographics | Rating | Rank | Master's Degree |
| Syrians | 98.3 /100 | #105 | Exceptional 16.8% |
| Immigrants | Albania | 98.1 /100 | #106 | Exceptional 16.8% |
| Armenians | 98.0 /100 | #107 | Exceptional 16.8% |
| Sierra Leoneans | 98.0 /100 | #108 | Exceptional 16.8% |
| Moroccans | 98.0 /100 | #109 | Exceptional 16.8% |
| Immigrants | Chile | 98.0 /100 | #110 | Exceptional 16.8% |
| Austrians | 97.8 /100 | #111 | Exceptional 16.7% |
| Macedonians | 97.7 /100 | #112 | Exceptional 16.7% |
| Arabs | 97.7 /100 | #113 | Exceptional 16.7% |
| Northern Europeans | 97.6 /100 | #114 | Exceptional 16.7% |
| Immigrants | Uganda | 97.3 /100 | #115 | Exceptional 16.6% |
| Immigrants | Southern Europe | 97.2 /100 | #116 | Exceptional 16.6% |
| Immigrants | Moldova | 97.2 /100 | #117 | Exceptional 16.6% |
| Brazilians | 96.8 /100 | #118 | Exceptional 16.5% |
| Jordanians | 96.5 /100 | #119 | Exceptional 16.5% |