Lumbee vs Filipino No Schooling Completed
COMPARE
Lumbee
Filipino
No Schooling Completed
No Schooling Completed Comparison
Lumbee
Filipinos
1.5%
NO SCHOOLING COMPLETED
100.0/ 100
METRIC RATING
29th/ 347
METRIC RANK
2.0%
NO SCHOOLING COMPLETED
85.5/ 100
METRIC RATING
137th/ 347
METRIC RANK
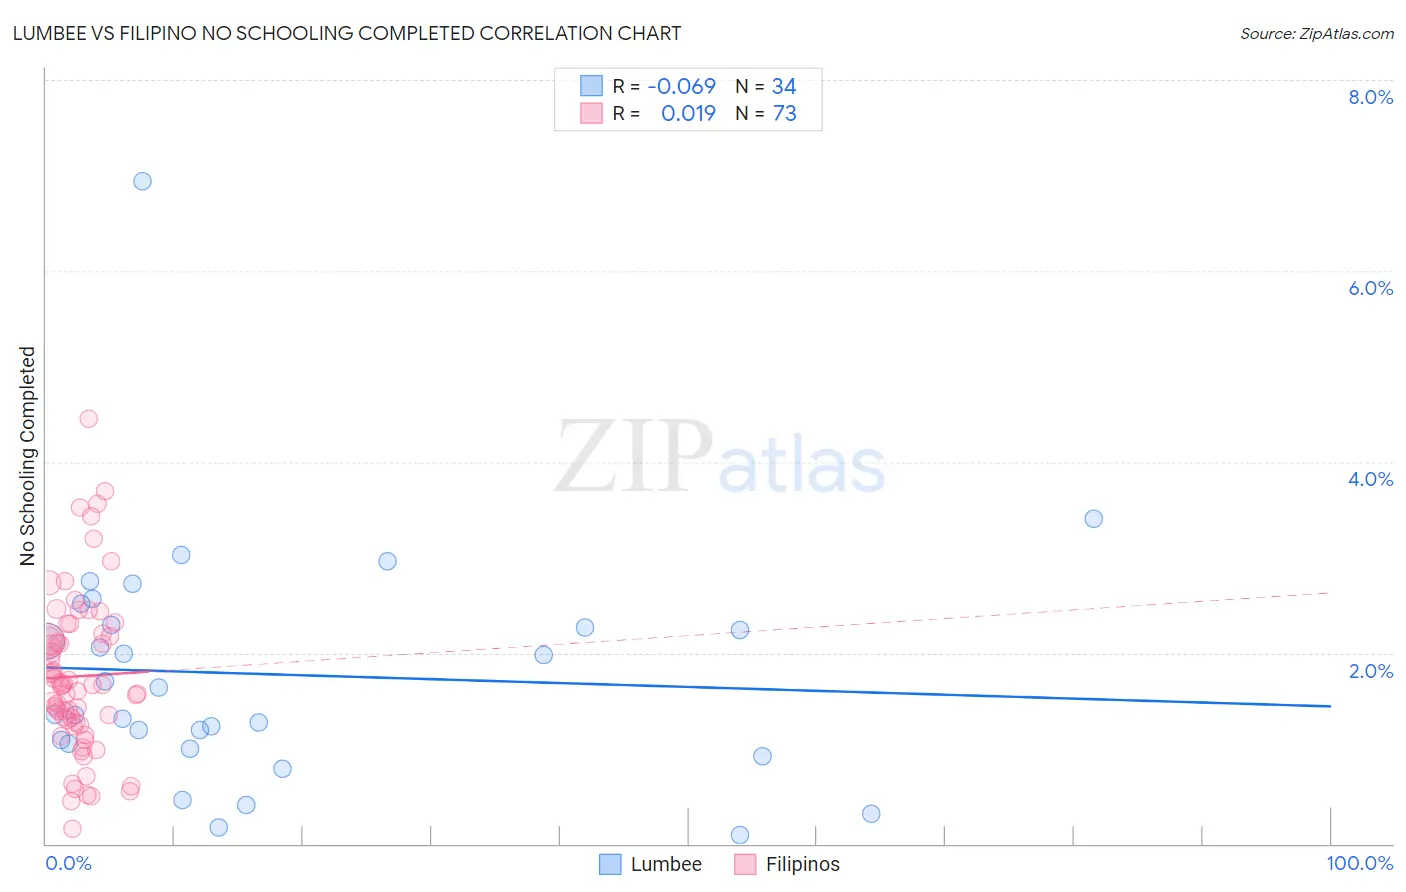
Lumbee vs Filipino No Schooling Completed Correlation Chart
The statistical analysis conducted on geographies consisting of 91,955,229 people shows a slight negative correlation between the proportion of Lumbee and percentage of population with no schooling in the United States with a correlation coefficient (R) of -0.069 and weighted average of 1.5%. Similarly, the statistical analysis conducted on geographies consisting of 252,358,967 people shows no correlation between the proportion of Filipinos and percentage of population with no schooling in the United States with a correlation coefficient (R) of 0.019 and weighted average of 2.0%, a difference of 29.9%.
No Schooling Completed Correlation Summary
| Measurement | Lumbee | Filipino |
| Minimum | 0.093% | 0.16% |
| Maximum | 6.9% | 4.5% |
| Range | 6.9% | 4.3% |
| Mean | 1.8% | 1.8% |
| Median | 1.5% | 1.7% |
| Interquartile 25% (IQ1) | 1.0% | 1.3% |
| Interquartile 75% (IQ3) | 2.3% | 2.2% |
| Interquartile Range (IQR) | 1.2% | 0.92% |
| Standard Deviation (Sample) | 1.3% | 0.84% |
| Standard Deviation (Population) | 1.2% | 0.83% |
Similar Demographics by No Schooling Completed
Demographics Similar to Lumbee by No Schooling Completed
In terms of no schooling completed, the demographic groups most similar to Lumbee are British (1.5%, a difference of 0.48%), Inupiat (1.5%, a difference of 0.51%), French Canadian (1.5%, a difference of 0.91%), Swiss (1.5%, a difference of 0.91%), and Scandinavian (1.5%, a difference of 0.92%).
| Demographics | Rating | Rank | No Schooling Completed |
| Alaska Natives | 100.0 /100 | #22 | Exceptional 1.5% |
| Europeans | 100.0 /100 | #23 | Exceptional 1.5% |
| Pennsylvania Germans | 100.0 /100 | #24 | Exceptional 1.5% |
| French | 100.0 /100 | #25 | Exceptional 1.5% |
| Czechs | 100.0 /100 | #26 | Exceptional 1.5% |
| Scandinavians | 100.0 /100 | #27 | Exceptional 1.5% |
| French Canadians | 100.0 /100 | #28 | Exceptional 1.5% |
| Lumbee | 100.0 /100 | #29 | Exceptional 1.5% |
| British | 100.0 /100 | #30 | Exceptional 1.5% |
| Inupiat | 100.0 /100 | #31 | Exceptional 1.5% |
| Swiss | 100.0 /100 | #32 | Exceptional 1.5% |
| Italians | 100.0 /100 | #33 | Exceptional 1.5% |
| Latvians | 100.0 /100 | #34 | Exceptional 1.5% |
| Eastern Europeans | 100.0 /100 | #35 | Exceptional 1.6% |
| Aleuts | 99.9 /100 | #36 | Exceptional 1.6% |
Demographics Similar to Filipinos by No Schooling Completed
In terms of no schooling completed, the demographic groups most similar to Filipinos are Immigrants from Israel (2.0%, a difference of 0.030%), Jordanian (2.0%, a difference of 0.29%), Marshallese (2.0%, a difference of 0.55%), Immigrants from Greece (2.0%, a difference of 0.56%), and Burmese (1.9%, a difference of 0.86%).
| Demographics | Rating | Rank | No Schooling Completed |
| Palestinians | 91.8 /100 | #130 | Exceptional 1.9% |
| Immigrants | Hungary | 91.6 /100 | #131 | Exceptional 1.9% |
| Colville | 90.4 /100 | #132 | Exceptional 1.9% |
| Immigrants | Turkey | 90.2 /100 | #133 | Exceptional 1.9% |
| Menominee | 89.6 /100 | #134 | Excellent 1.9% |
| Hmong | 88.5 /100 | #135 | Excellent 1.9% |
| Burmese | 88.2 /100 | #136 | Excellent 1.9% |
| Filipinos | 85.5 /100 | #137 | Excellent 2.0% |
| Immigrants | Israel | 85.4 /100 | #138 | Excellent 2.0% |
| Jordanians | 84.5 /100 | #139 | Excellent 2.0% |
| Marshallese | 83.5 /100 | #140 | Excellent 2.0% |
| Immigrants | Greece | 83.5 /100 | #141 | Excellent 2.0% |
| Venezuelans | 81.5 /100 | #142 | Excellent 2.0% |
| Immigrants | South Central Asia | 80.0 /100 | #143 | Good 2.0% |
| Alsatians | 79.1 /100 | #144 | Good 2.0% |