Immigrants from Iraq vs Filipino No Schooling Completed
COMPARE
Immigrants from Iraq
Filipino
No Schooling Completed
No Schooling Completed Comparison
Immigrants from Iraq
Filipinos
2.4%
NO SCHOOLING COMPLETED
1.3/ 100
METRIC RATING
247th/ 347
METRIC RANK
2.0%
NO SCHOOLING COMPLETED
85.5/ 100
METRIC RATING
137th/ 347
METRIC RANK
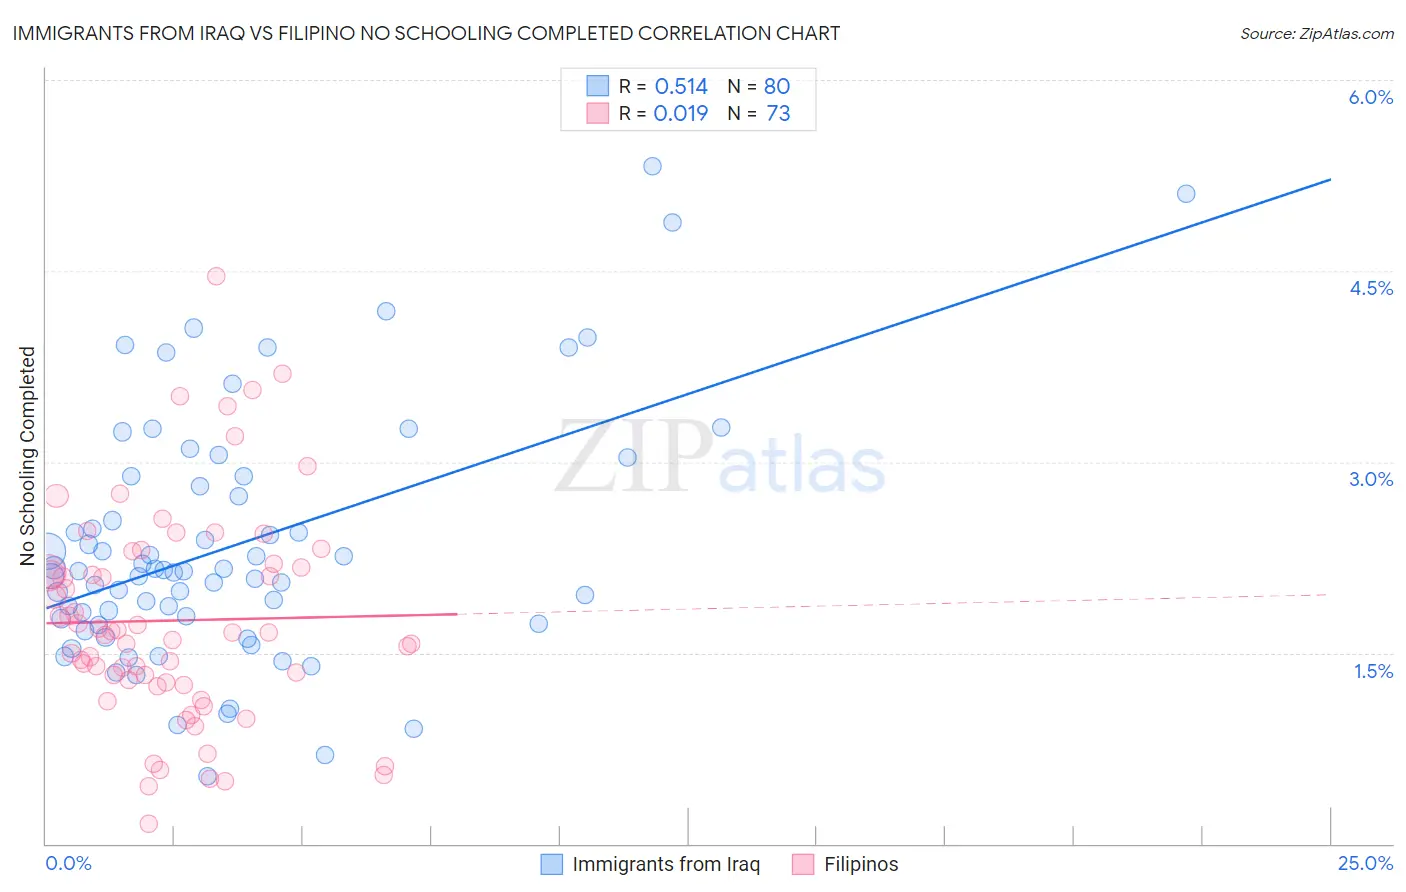
Immigrants from Iraq vs Filipino No Schooling Completed Correlation Chart
The statistical analysis conducted on geographies consisting of 194,285,725 people shows a substantial positive correlation between the proportion of Immigrants from Iraq and percentage of population with no schooling in the United States with a correlation coefficient (R) of 0.514 and weighted average of 2.4%. Similarly, the statistical analysis conducted on geographies consisting of 252,358,967 people shows no correlation between the proportion of Filipinos and percentage of population with no schooling in the United States with a correlation coefficient (R) of 0.019 and weighted average of 2.0%, a difference of 21.7%.
No Schooling Completed Correlation Summary
| Measurement | Immigrants from Iraq | Filipino |
| Minimum | 0.53% | 0.16% |
| Maximum | 5.3% | 4.5% |
| Range | 4.8% | 4.3% |
| Mean | 2.3% | 1.8% |
| Median | 2.1% | 1.7% |
| Interquartile 25% (IQ1) | 1.7% | 1.3% |
| Interquartile 75% (IQ3) | 2.8% | 2.2% |
| Interquartile Range (IQR) | 1.1% | 0.92% |
| Standard Deviation (Sample) | 0.98% | 0.84% |
| Standard Deviation (Population) | 0.97% | 0.83% |
Similar Demographics by No Schooling Completed
Demographics Similar to Immigrants from Iraq by No Schooling Completed
In terms of no schooling completed, the demographic groups most similar to Immigrants from Iraq are Immigrants from Congo (2.4%, a difference of 0.11%), Peruvian (2.4%, a difference of 0.16%), Bolivian (2.4%, a difference of 0.16%), South American (2.4%, a difference of 0.27%), and Asian (2.4%, a difference of 0.27%).
| Demographics | Rating | Rank | No Schooling Completed |
| Immigrants | Senegal | 1.7 /100 | #240 | Tragic 2.4% |
| Koreans | 1.7 /100 | #241 | Tragic 2.4% |
| Immigrants | Indonesia | 1.5 /100 | #242 | Tragic 2.4% |
| South Americans | 1.5 /100 | #243 | Tragic 2.4% |
| Peruvians | 1.4 /100 | #244 | Tragic 2.4% |
| Bolivians | 1.4 /100 | #245 | Tragic 2.4% |
| Immigrants | Congo | 1.4 /100 | #246 | Tragic 2.4% |
| Immigrants | Iraq | 1.3 /100 | #247 | Tragic 2.4% |
| Asians | 1.2 /100 | #248 | Tragic 2.4% |
| Jamaicans | 1.2 /100 | #249 | Tragic 2.4% |
| Immigrants | Middle Africa | 1.1 /100 | #250 | Tragic 2.4% |
| Immigrants | Africa | 1.1 /100 | #251 | Tragic 2.4% |
| Immigrants | Colombia | 1.0 /100 | #252 | Tragic 2.4% |
| Immigrants | Asia | 0.9 /100 | #253 | Tragic 2.4% |
| Immigrants | Eastern Africa | 0.9 /100 | #254 | Tragic 2.4% |
Demographics Similar to Filipinos by No Schooling Completed
In terms of no schooling completed, the demographic groups most similar to Filipinos are Immigrants from Israel (2.0%, a difference of 0.030%), Jordanian (2.0%, a difference of 0.29%), Marshallese (2.0%, a difference of 0.55%), Immigrants from Greece (2.0%, a difference of 0.56%), and Burmese (1.9%, a difference of 0.86%).
| Demographics | Rating | Rank | No Schooling Completed |
| Palestinians | 91.8 /100 | #130 | Exceptional 1.9% |
| Immigrants | Hungary | 91.6 /100 | #131 | Exceptional 1.9% |
| Colville | 90.4 /100 | #132 | Exceptional 1.9% |
| Immigrants | Turkey | 90.2 /100 | #133 | Exceptional 1.9% |
| Menominee | 89.6 /100 | #134 | Excellent 1.9% |
| Hmong | 88.5 /100 | #135 | Excellent 1.9% |
| Burmese | 88.2 /100 | #136 | Excellent 1.9% |
| Filipinos | 85.5 /100 | #137 | Excellent 2.0% |
| Immigrants | Israel | 85.4 /100 | #138 | Excellent 2.0% |
| Jordanians | 84.5 /100 | #139 | Excellent 2.0% |
| Marshallese | 83.5 /100 | #140 | Excellent 2.0% |
| Immigrants | Greece | 83.5 /100 | #141 | Excellent 2.0% |
| Venezuelans | 81.5 /100 | #142 | Excellent 2.0% |
| Immigrants | South Central Asia | 80.0 /100 | #143 | Good 2.0% |
| Alsatians | 79.1 /100 | #144 | Good 2.0% |