Salvadoran vs Filipino No Schooling Completed
COMPARE
Salvadoran
Filipino
No Schooling Completed
No Schooling Completed Comparison
Salvadorans
Filipinos
3.7%
NO SCHOOLING COMPLETED
0.0/ 100
METRIC RATING
343rd/ 347
METRIC RANK
2.0%
NO SCHOOLING COMPLETED
85.5/ 100
METRIC RATING
137th/ 347
METRIC RANK
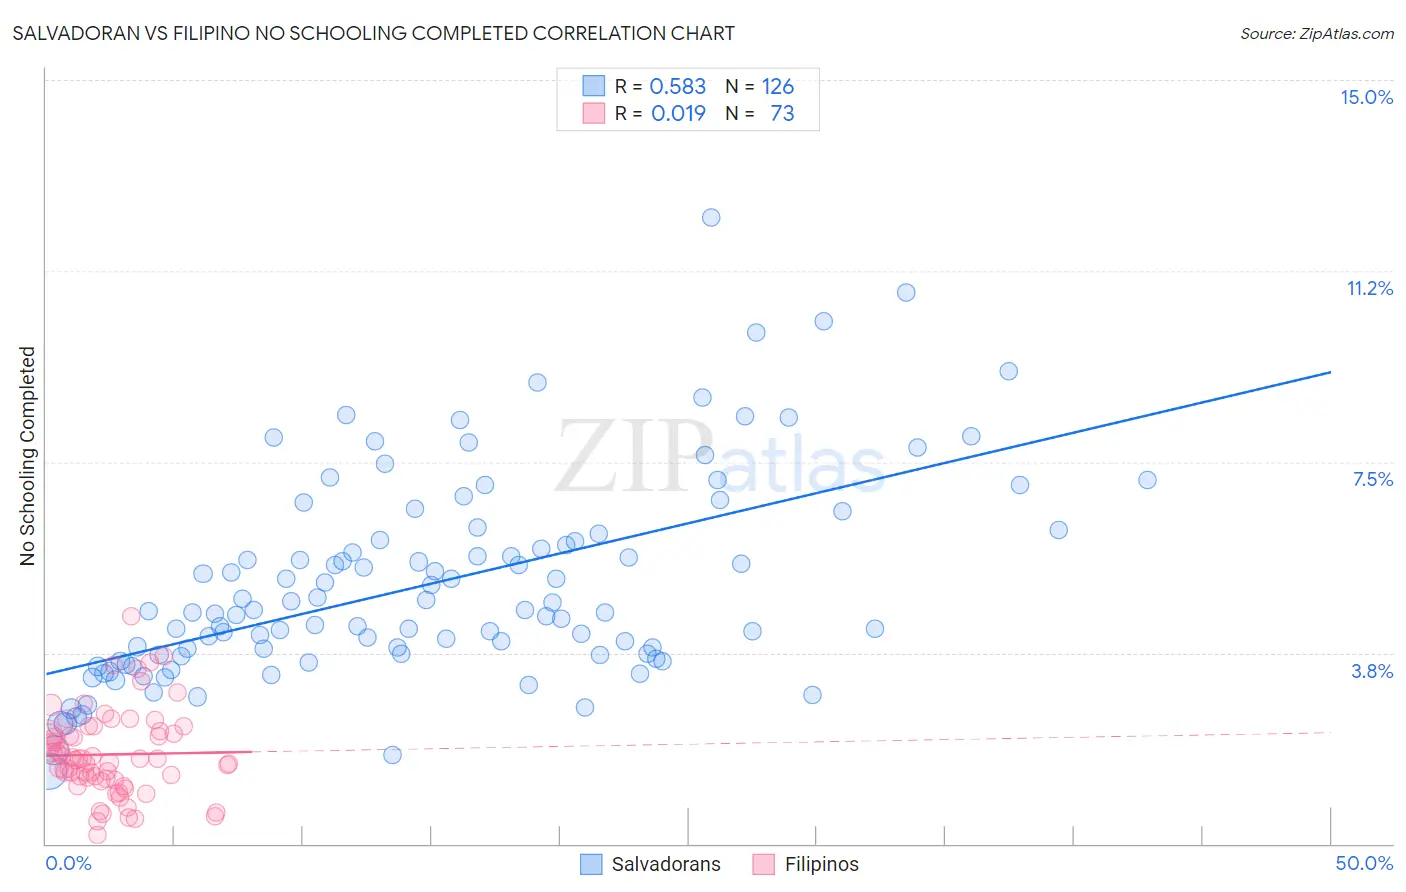
Salvadoran vs Filipino No Schooling Completed Correlation Chart
The statistical analysis conducted on geographies consisting of 395,950,136 people shows a substantial positive correlation between the proportion of Salvadorans and percentage of population with no schooling in the United States with a correlation coefficient (R) of 0.583 and weighted average of 3.7%. Similarly, the statistical analysis conducted on geographies consisting of 252,358,967 people shows no correlation between the proportion of Filipinos and percentage of population with no schooling in the United States with a correlation coefficient (R) of 0.019 and weighted average of 2.0%, a difference of 90.4%.
No Schooling Completed Correlation Summary
| Measurement | Salvadoran | Filipino |
| Minimum | 1.4% | 0.16% |
| Maximum | 12.3% | 4.5% |
| Range | 10.9% | 4.3% |
| Mean | 5.1% | 1.8% |
| Median | 4.6% | 1.7% |
| Interquartile 25% (IQ1) | 3.7% | 1.3% |
| Interquartile 75% (IQ3) | 6.0% | 2.2% |
| Interquartile Range (IQR) | 2.3% | 0.92% |
| Standard Deviation (Sample) | 2.0% | 0.84% |
| Standard Deviation (Population) | 2.0% | 0.83% |
Similar Demographics by No Schooling Completed
Demographics Similar to Salvadorans by No Schooling Completed
In terms of no schooling completed, the demographic groups most similar to Salvadorans are Nepalese (3.8%, a difference of 1.7%), Immigrants from Mexico (3.6%, a difference of 2.8%), Immigrants from El Salvador (3.9%, a difference of 3.5%), Immigrants from Central America (3.6%, a difference of 3.6%), and Immigrants from Guatemala (3.6%, a difference of 4.7%).
| Demographics | Rating | Rank | No Schooling Completed |
| Immigrants | Dominican Republic | 0.0 /100 | #333 | Tragic 3.4% |
| Guatemalans | 0.0 /100 | #334 | Tragic 3.5% |
| Immigrants | Cambodia | 0.0 /100 | #335 | Tragic 3.5% |
| Immigrants | Fiji | 0.0 /100 | #336 | Tragic 3.5% |
| Immigrants | Cabo Verde | 0.0 /100 | #337 | Tragic 3.5% |
| Bangladeshis | 0.0 /100 | #338 | Tragic 3.5% |
| Yakama | 0.0 /100 | #339 | Tragic 3.6% |
| Immigrants | Guatemala | 0.0 /100 | #340 | Tragic 3.6% |
| Immigrants | Central America | 0.0 /100 | #341 | Tragic 3.6% |
| Immigrants | Mexico | 0.0 /100 | #342 | Tragic 3.6% |
| Salvadorans | 0.0 /100 | #343 | Tragic 3.7% |
| Nepalese | 0.0 /100 | #344 | Tragic 3.8% |
| Immigrants | El Salvador | 0.0 /100 | #345 | Tragic 3.9% |
| Immigrants | Yemen | 0.0 /100 | #346 | Tragic 4.1% |
| Spanish American Indians | 0.0 /100 | #347 | Tragic 4.2% |
Demographics Similar to Filipinos by No Schooling Completed
In terms of no schooling completed, the demographic groups most similar to Filipinos are Immigrants from Israel (2.0%, a difference of 0.030%), Jordanian (2.0%, a difference of 0.29%), Marshallese (2.0%, a difference of 0.55%), Immigrants from Greece (2.0%, a difference of 0.56%), and Burmese (1.9%, a difference of 0.86%).
| Demographics | Rating | Rank | No Schooling Completed |
| Palestinians | 91.8 /100 | #130 | Exceptional 1.9% |
| Immigrants | Hungary | 91.6 /100 | #131 | Exceptional 1.9% |
| Colville | 90.4 /100 | #132 | Exceptional 1.9% |
| Immigrants | Turkey | 90.2 /100 | #133 | Exceptional 1.9% |
| Menominee | 89.6 /100 | #134 | Excellent 1.9% |
| Hmong | 88.5 /100 | #135 | Excellent 1.9% |
| Burmese | 88.2 /100 | #136 | Excellent 1.9% |
| Filipinos | 85.5 /100 | #137 | Excellent 2.0% |
| Immigrants | Israel | 85.4 /100 | #138 | Excellent 2.0% |
| Jordanians | 84.5 /100 | #139 | Excellent 2.0% |
| Marshallese | 83.5 /100 | #140 | Excellent 2.0% |
| Immigrants | Greece | 83.5 /100 | #141 | Excellent 2.0% |
| Venezuelans | 81.5 /100 | #142 | Excellent 2.0% |
| Immigrants | South Central Asia | 80.0 /100 | #143 | Good 2.0% |
| Alsatians | 79.1 /100 | #144 | Good 2.0% |