Assyrian/Chaldean/Syriac vs Ugandan 9th Grade
COMPARE
Assyrian/Chaldean/Syriac
Ugandan
9th Grade
9th Grade Comparison
Assyrians/Chaldeans/Syriacs
Ugandans
94.7%
9TH GRADE
32.0/ 100
METRIC RATING
191st/ 347
METRIC RANK
95.1%
9TH GRADE
77.0/ 100
METRIC RATING
152nd/ 347
METRIC RANK
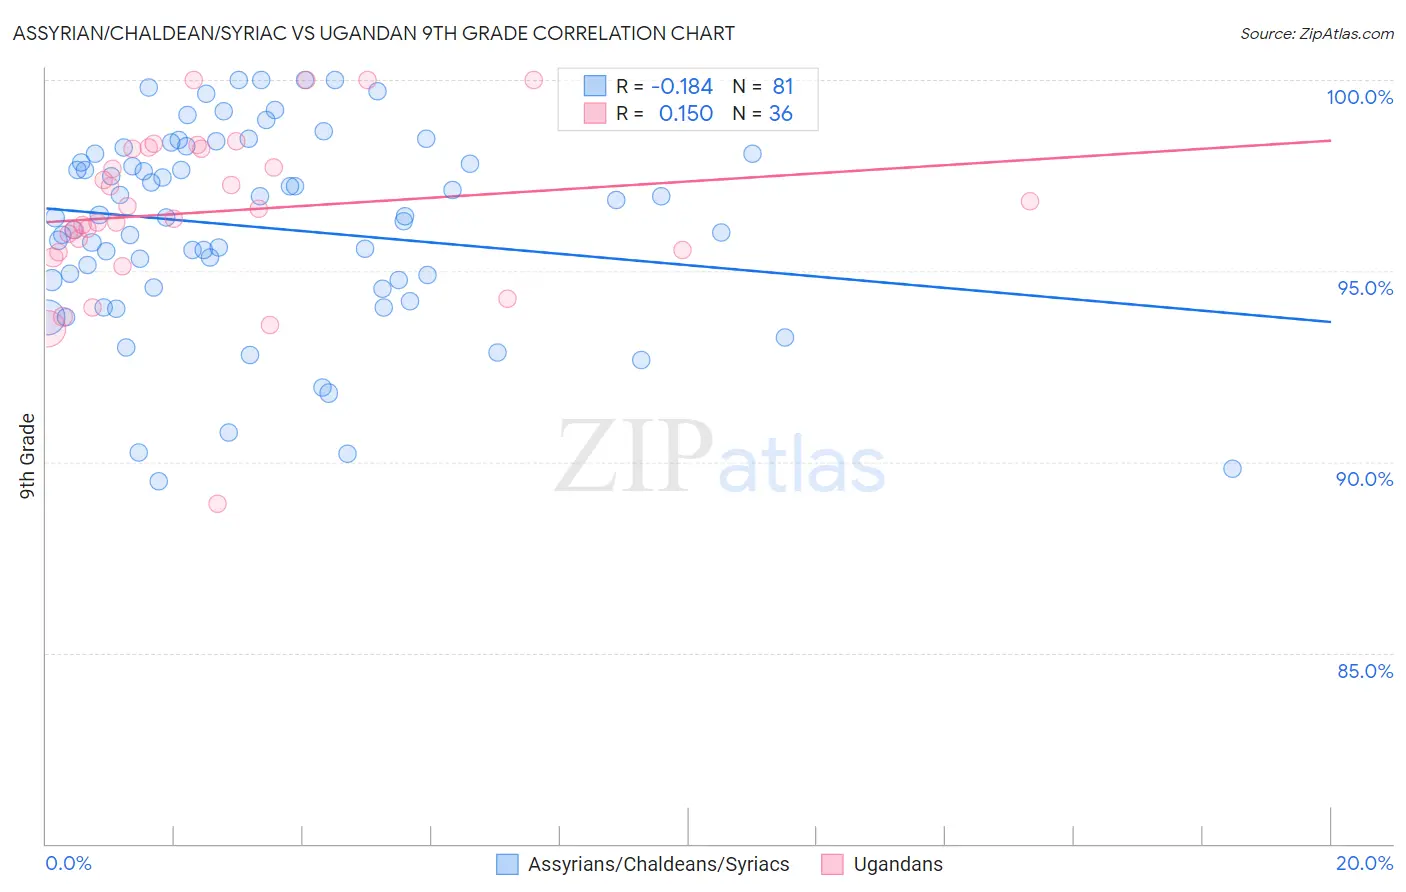
Assyrian/Chaldean/Syriac vs Ugandan 9th Grade Correlation Chart
The statistical analysis conducted on geographies consisting of 110,318,304 people shows a poor negative correlation between the proportion of Assyrians/Chaldeans/Syriacs and percentage of population with at least 9th grade education in the United States with a correlation coefficient (R) of -0.184 and weighted average of 94.7%. Similarly, the statistical analysis conducted on geographies consisting of 93,991,892 people shows a poor positive correlation between the proportion of Ugandans and percentage of population with at least 9th grade education in the United States with a correlation coefficient (R) of 0.150 and weighted average of 95.1%, a difference of 0.36%.
9th Grade Correlation Summary
| Measurement | Assyrian/Chaldean/Syriac | Ugandan |
| Minimum | 89.5% | 88.9% |
| Maximum | 100.0% | 100.0% |
| Range | 10.5% | 11.1% |
| Mean | 96.1% | 96.6% |
| Median | 96.4% | 96.5% |
| Interquartile 25% (IQ1) | 94.7% | 95.5% |
| Interquartile 75% (IQ3) | 98.1% | 98.2% |
| Interquartile Range (IQR) | 3.4% | 2.7% |
| Standard Deviation (Sample) | 2.6% | 2.2% |
| Standard Deviation (Population) | 2.5% | 2.2% |
Similar Demographics by 9th Grade
Demographics Similar to Assyrians/Chaldeans/Syriacs by 9th Grade
In terms of 9th grade, the demographic groups most similar to Assyrians/Chaldeans/Syriacs are Sudanese (94.7%, a difference of 0.010%), Immigrants from Northern Africa (94.7%, a difference of 0.010%), Immigrants from Albania (94.8%, a difference of 0.020%), Immigrants from Argentina (94.8%, a difference of 0.020%), and Paraguayan (94.7%, a difference of 0.020%).
| Demographics | Rating | Rank | 9th Grade |
| Argentineans | 37.6 /100 | #184 | Fair 94.8% |
| Liberians | 37.4 /100 | #185 | Fair 94.8% |
| Hopi | 37.1 /100 | #186 | Fair 94.8% |
| Guamanians/Chamorros | 35.5 /100 | #187 | Fair 94.8% |
| Immigrants | Albania | 34.5 /100 | #188 | Fair 94.8% |
| Immigrants | Argentina | 34.4 /100 | #189 | Fair 94.8% |
| Sudanese | 32.7 /100 | #190 | Fair 94.7% |
| Assyrians/Chaldeans/Syriacs | 32.0 /100 | #191 | Fair 94.7% |
| Immigrants | Northern Africa | 30.7 /100 | #192 | Fair 94.7% |
| Paraguayans | 30.1 /100 | #193 | Fair 94.7% |
| Panamanians | 29.0 /100 | #194 | Fair 94.7% |
| Marshallese | 27.9 /100 | #195 | Fair 94.7% |
| Immigrants | Lebanon | 27.2 /100 | #196 | Fair 94.7% |
| Immigrants | Micronesia | 24.7 /100 | #197 | Fair 94.7% |
| Hawaiians | 22.7 /100 | #198 | Fair 94.7% |
Demographics Similar to Ugandans by 9th Grade
In terms of 9th grade, the demographic groups most similar to Ugandans are Cajun (95.1%, a difference of 0.0%), Albanian (95.1%, a difference of 0.010%), Kenyan (95.1%, a difference of 0.020%), Arab (95.1%, a difference of 0.020%), and Immigrants from Kazakhstan (95.1%, a difference of 0.020%).
| Demographics | Rating | Rank | 9th Grade |
| Pueblo | 82.2 /100 | #145 | Excellent 95.1% |
| Immigrants | Sri Lanka | 82.1 /100 | #146 | Excellent 95.1% |
| Choctaw | 81.9 /100 | #147 | Excellent 95.1% |
| Immigrants | Jordan | 81.2 /100 | #148 | Excellent 95.1% |
| Immigrants | Korea | 79.6 /100 | #149 | Good 95.1% |
| Kenyans | 79.1 /100 | #150 | Good 95.1% |
| Cajuns | 77.3 /100 | #151 | Good 95.1% |
| Ugandans | 77.0 /100 | #152 | Good 95.1% |
| Albanians | 76.1 /100 | #153 | Good 95.1% |
| Arabs | 74.9 /100 | #154 | Good 95.1% |
| Immigrants | Kazakhstan | 74.7 /100 | #155 | Good 95.1% |
| Immigrants | Kenya | 73.1 /100 | #156 | Good 95.0% |
| Mongolians | 73.0 /100 | #157 | Good 95.0% |
| Egyptians | 70.1 /100 | #158 | Good 95.0% |
| Immigrants | Ukraine | 67.4 /100 | #159 | Good 95.0% |