Immigrants from Sudan vs Ugandan 9th Grade
COMPARE
Immigrants from Sudan
Ugandan
9th Grade
9th Grade Comparison
Immigrants from Sudan
Ugandans
94.6%
9TH GRADE
17.6/ 100
METRIC RATING
205th/ 347
METRIC RANK
95.1%
9TH GRADE
77.0/ 100
METRIC RATING
152nd/ 347
METRIC RANK
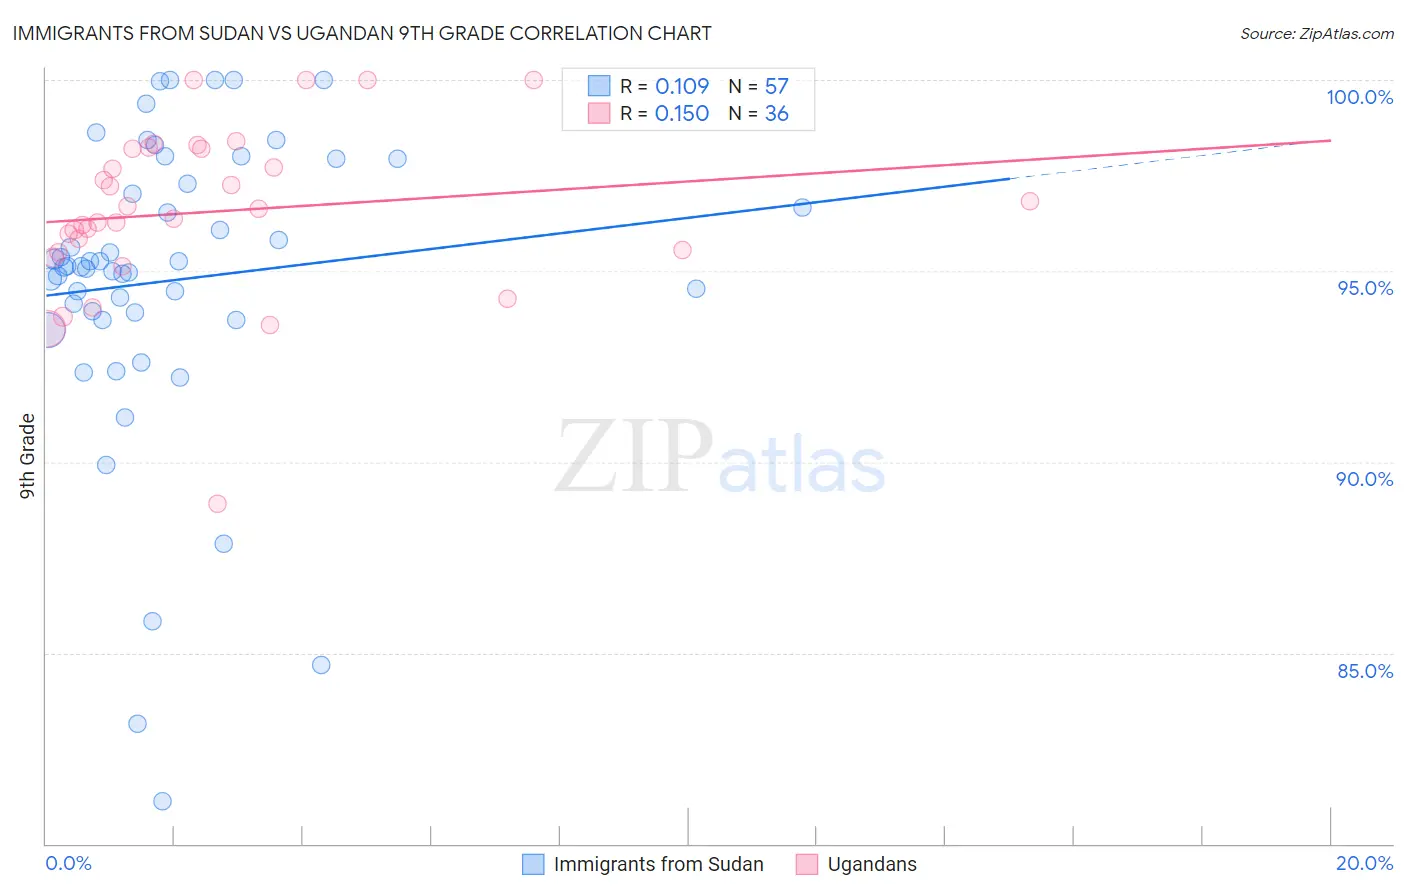
Immigrants from Sudan vs Ugandan 9th Grade Correlation Chart
The statistical analysis conducted on geographies consisting of 118,959,807 people shows a poor positive correlation between the proportion of Immigrants from Sudan and percentage of population with at least 9th grade education in the United States with a correlation coefficient (R) of 0.109 and weighted average of 94.6%. Similarly, the statistical analysis conducted on geographies consisting of 93,991,892 people shows a poor positive correlation between the proportion of Ugandans and percentage of population with at least 9th grade education in the United States with a correlation coefficient (R) of 0.150 and weighted average of 95.1%, a difference of 0.51%.
9th Grade Correlation Summary
| Measurement | Immigrants from Sudan | Ugandan |
| Minimum | 81.1% | 88.9% |
| Maximum | 100.0% | 100.0% |
| Range | 18.9% | 11.1% |
| Mean | 94.8% | 96.6% |
| Median | 95.1% | 96.5% |
| Interquartile 25% (IQ1) | 93.8% | 95.5% |
| Interquartile 75% (IQ3) | 97.6% | 98.2% |
| Interquartile Range (IQR) | 3.8% | 2.7% |
| Standard Deviation (Sample) | 4.0% | 2.2% |
| Standard Deviation (Population) | 4.0% | 2.2% |
Similar Demographics by 9th Grade
Demographics Similar to Immigrants from Sudan by 9th Grade
In terms of 9th grade, the demographic groups most similar to Immigrants from Sudan are Samoan (94.6%, a difference of 0.0%), Moroccan (94.6%, a difference of 0.020%), Immigrants from Morocco (94.6%, a difference of 0.020%), Immigrants from Zaire (94.6%, a difference of 0.030%), and Black/African American (94.6%, a difference of 0.030%).
| Demographics | Rating | Rank | 9th Grade |
| Hawaiians | 22.7 /100 | #198 | Fair 94.7% |
| Laotians | 21.0 /100 | #199 | Fair 94.6% |
| Immigrants | Zaire | 20.6 /100 | #200 | Fair 94.6% |
| Blacks/African Americans | 20.5 /100 | #201 | Fair 94.6% |
| Immigrants | Eastern Asia | 19.8 /100 | #202 | Poor 94.6% |
| Immigrants | Bahamas | 19.8 /100 | #203 | Poor 94.6% |
| Moroccans | 19.6 /100 | #204 | Poor 94.6% |
| Immigrants | Sudan | 17.6 /100 | #205 | Poor 94.6% |
| Samoans | 17.3 /100 | #206 | Poor 94.6% |
| Immigrants | Morocco | 16.3 /100 | #207 | Poor 94.6% |
| Immigrants | Pakistan | 15.5 /100 | #208 | Poor 94.6% |
| Comanche | 14.9 /100 | #209 | Poor 94.6% |
| Immigrants | Chile | 13.4 /100 | #210 | Poor 94.5% |
| Immigrants | Indonesia | 12.3 /100 | #211 | Poor 94.5% |
| Immigrants | Malaysia | 12.2 /100 | #212 | Poor 94.5% |
Demographics Similar to Ugandans by 9th Grade
In terms of 9th grade, the demographic groups most similar to Ugandans are Cajun (95.1%, a difference of 0.0%), Albanian (95.1%, a difference of 0.010%), Kenyan (95.1%, a difference of 0.020%), Arab (95.1%, a difference of 0.020%), and Immigrants from Kazakhstan (95.1%, a difference of 0.020%).
| Demographics | Rating | Rank | 9th Grade |
| Pueblo | 82.2 /100 | #145 | Excellent 95.1% |
| Immigrants | Sri Lanka | 82.1 /100 | #146 | Excellent 95.1% |
| Choctaw | 81.9 /100 | #147 | Excellent 95.1% |
| Immigrants | Jordan | 81.2 /100 | #148 | Excellent 95.1% |
| Immigrants | Korea | 79.6 /100 | #149 | Good 95.1% |
| Kenyans | 79.1 /100 | #150 | Good 95.1% |
| Cajuns | 77.3 /100 | #151 | Good 95.1% |
| Ugandans | 77.0 /100 | #152 | Good 95.1% |
| Albanians | 76.1 /100 | #153 | Good 95.1% |
| Arabs | 74.9 /100 | #154 | Good 95.1% |
| Immigrants | Kazakhstan | 74.7 /100 | #155 | Good 95.1% |
| Immigrants | Kenya | 73.1 /100 | #156 | Good 95.0% |
| Mongolians | 73.0 /100 | #157 | Good 95.0% |
| Egyptians | 70.1 /100 | #158 | Good 95.0% |
| Immigrants | Ukraine | 67.4 /100 | #159 | Good 95.0% |