Hungarian vs Cree 9th Grade
COMPARE
Hungarian
Cree
9th Grade
9th Grade Comparison
Hungarians
Cree
96.2%
9TH GRADE
100.0/ 100
METRIC RATING
34th/ 347
METRIC RANK
95.4%
9TH GRADE
95.5/ 100
METRIC RATING
121st/ 347
METRIC RANK
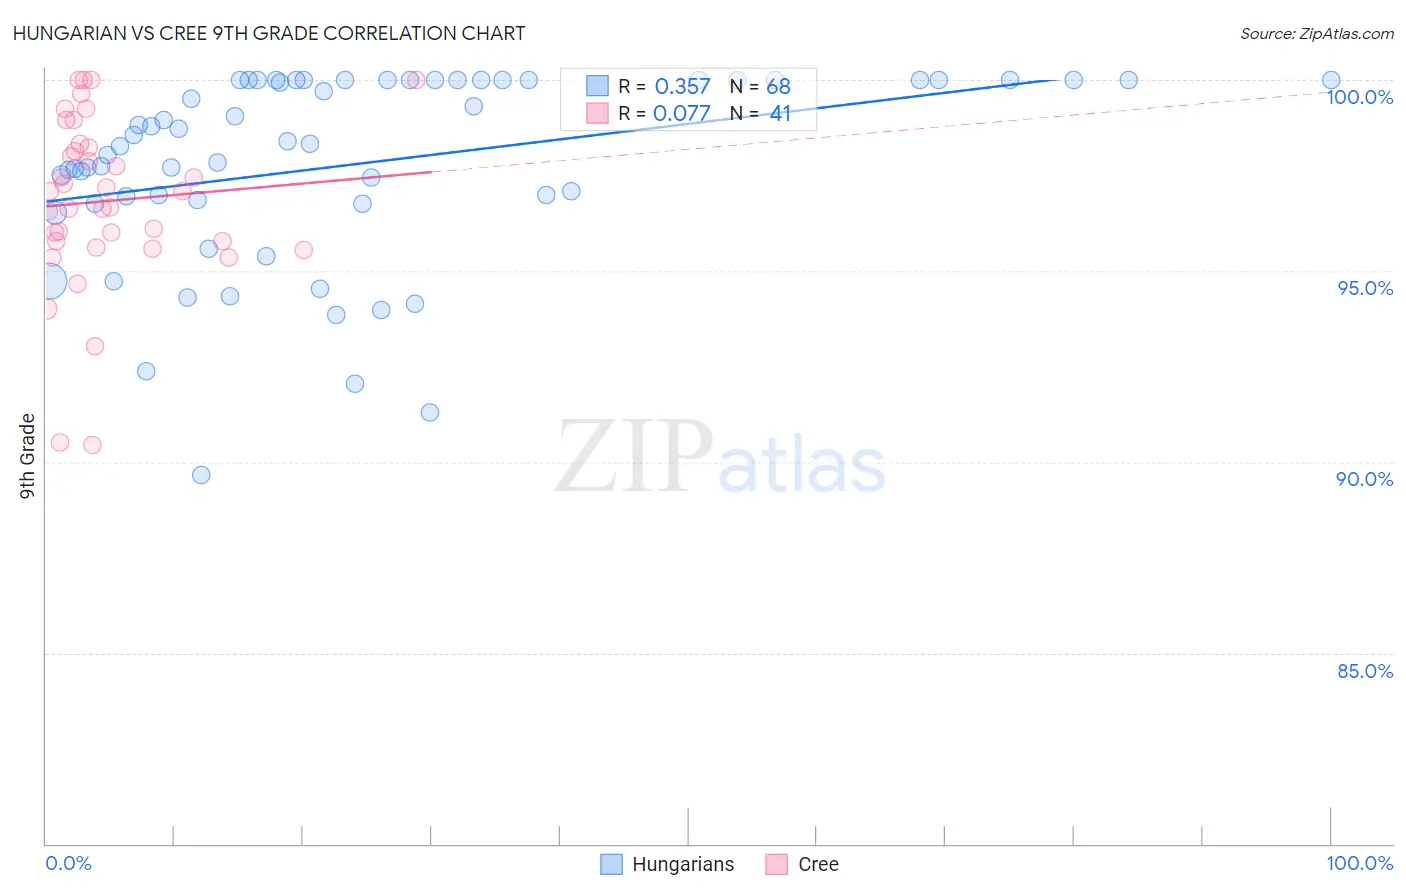
Hungarian vs Cree 9th Grade Correlation Chart
The statistical analysis conducted on geographies consisting of 486,239,439 people shows a mild positive correlation between the proportion of Hungarians and percentage of population with at least 9th grade education in the United States with a correlation coefficient (R) of 0.357 and weighted average of 96.2%. Similarly, the statistical analysis conducted on geographies consisting of 76,211,744 people shows a slight positive correlation between the proportion of Cree and percentage of population with at least 9th grade education in the United States with a correlation coefficient (R) of 0.077 and weighted average of 95.4%, a difference of 0.86%.
9th Grade Correlation Summary
| Measurement | Hungarian | Cree |
| Minimum | 89.7% | 90.4% |
| Maximum | 100.0% | 100.0% |
| Range | 10.3% | 9.6% |
| Mean | 97.8% | 96.8% |
| Median | 98.4% | 97.1% |
| Interquartile 25% (IQ1) | 96.8% | 95.7% |
| Interquartile 75% (IQ3) | 100.0% | 98.3% |
| Interquartile Range (IQR) | 3.2% | 2.6% |
| Standard Deviation (Sample) | 2.5% | 2.2% |
| Standard Deviation (Population) | 2.5% | 2.2% |
Similar Demographics by 9th Grade
Demographics Similar to Hungarians by 9th Grade
In terms of 9th grade, the demographic groups most similar to Hungarians are Luxembourger (96.3%, a difference of 0.030%), British (96.3%, a difference of 0.040%), Belgian (96.3%, a difference of 0.040%), Bulgarian (96.2%, a difference of 0.040%), and Northern European (96.2%, a difference of 0.040%).
| Demographics | Rating | Rank | 9th Grade |
| Scotch-Irish | 100.0 /100 | #27 | Exceptional 96.3% |
| Eastern Europeans | 100.0 /100 | #28 | Exceptional 96.3% |
| Chinese | 100.0 /100 | #29 | Exceptional 96.3% |
| Maltese | 100.0 /100 | #30 | Exceptional 96.3% |
| British | 100.0 /100 | #31 | Exceptional 96.3% |
| Belgians | 100.0 /100 | #32 | Exceptional 96.3% |
| Luxembourgers | 100.0 /100 | #33 | Exceptional 96.3% |
| Hungarians | 100.0 /100 | #34 | Exceptional 96.2% |
| Bulgarians | 99.9 /100 | #35 | Exceptional 96.2% |
| Northern Europeans | 99.9 /100 | #36 | Exceptional 96.2% |
| Estonians | 99.9 /100 | #37 | Exceptional 96.1% |
| Immigrants | Scotland | 99.9 /100 | #38 | Exceptional 96.1% |
| Ottawa | 99.9 /100 | #39 | Exceptional 96.1% |
| Slavs | 99.9 /100 | #40 | Exceptional 96.1% |
| Czechoslovakians | 99.9 /100 | #41 | Exceptional 96.1% |
Demographics Similar to Cree by 9th Grade
In terms of 9th grade, the demographic groups most similar to Cree are Immigrants from Romania (95.4%, a difference of 0.0%), Immigrants from Turkey (95.4%, a difference of 0.0%), Soviet Union (95.4%, a difference of 0.0%), Cambodian (95.4%, a difference of 0.0%), and Immigrants from Kuwait (95.4%, a difference of 0.0%).
| Demographics | Rating | Rank | 9th Grade |
| German Russians | 96.1 /100 | #114 | Exceptional 95.4% |
| Burmese | 96.0 /100 | #115 | Exceptional 95.4% |
| Immigrants | Europe | 95.7 /100 | #116 | Exceptional 95.4% |
| Immigrants | Romania | 95.6 /100 | #117 | Exceptional 95.4% |
| Immigrants | Turkey | 95.6 /100 | #118 | Exceptional 95.4% |
| Soviet Union | 95.6 /100 | #119 | Exceptional 95.4% |
| Cambodians | 95.6 /100 | #120 | Exceptional 95.4% |
| Cree | 95.5 /100 | #121 | Exceptional 95.4% |
| Immigrants | Kuwait | 95.5 /100 | #122 | Exceptional 95.4% |
| Kiowa | 95.3 /100 | #123 | Exceptional 95.4% |
| Shoshone | 95.3 /100 | #124 | Exceptional 95.4% |
| Immigrants | South Central Asia | 95.1 /100 | #125 | Exceptional 95.4% |
| Immigrants | Serbia | 94.4 /100 | #126 | Exceptional 95.4% |
| Palestinians | 94.3 /100 | #127 | Exceptional 95.4% |
| Immigrants | Hungary | 94.2 /100 | #128 | Exceptional 95.4% |