Somali vs Ugandan 9th Grade
COMPARE
Somali
Ugandan
9th Grade
9th Grade Comparison
Somalis
Ugandans
94.3%
9TH GRADE
2.9/ 100
METRIC RATING
236th/ 347
METRIC RANK
95.1%
9TH GRADE
77.0/ 100
METRIC RATING
152nd/ 347
METRIC RANK
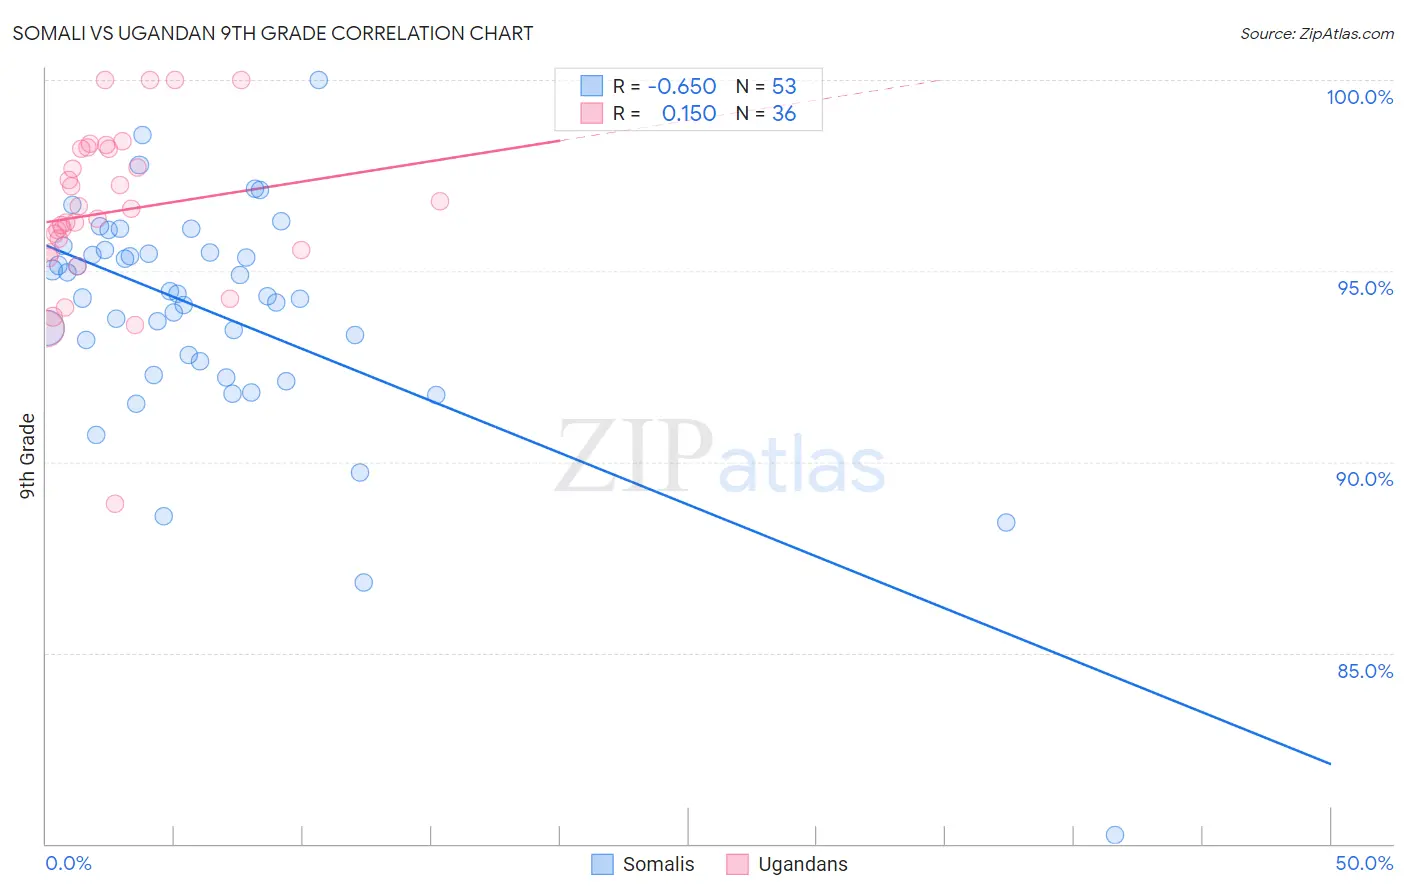
Somali vs Ugandan 9th Grade Correlation Chart
The statistical analysis conducted on geographies consisting of 99,330,527 people shows a significant negative correlation between the proportion of Somalis and percentage of population with at least 9th grade education in the United States with a correlation coefficient (R) of -0.650 and weighted average of 94.3%. Similarly, the statistical analysis conducted on geographies consisting of 93,991,892 people shows a poor positive correlation between the proportion of Ugandans and percentage of population with at least 9th grade education in the United States with a correlation coefficient (R) of 0.150 and weighted average of 95.1%, a difference of 0.87%.
9th Grade Correlation Summary
| Measurement | Somali | Ugandan |
| Minimum | 80.2% | 88.9% |
| Maximum | 100.0% | 100.0% |
| Range | 19.8% | 11.1% |
| Mean | 93.9% | 96.6% |
| Median | 94.4% | 96.5% |
| Interquartile 25% (IQ1) | 92.5% | 95.5% |
| Interquartile 75% (IQ3) | 95.5% | 98.2% |
| Interquartile Range (IQR) | 3.1% | 2.7% |
| Standard Deviation (Sample) | 3.1% | 2.2% |
| Standard Deviation (Population) | 3.1% | 2.2% |
Similar Demographics by 9th Grade
Demographics Similar to Somalis by 9th Grade
In terms of 9th grade, the demographic groups most similar to Somalis are Korean (94.3%, a difference of 0.0%), South American Indian (94.3%, a difference of 0.010%), Immigrants from China (94.3%, a difference of 0.010%), Bolivian (94.3%, a difference of 0.020%), and Immigrants from Ethiopia (94.3%, a difference of 0.020%).
| Demographics | Rating | Rank | 9th Grade |
| Immigrants | Southern Europe | 4.5 /100 | #229 | Tragic 94.3% |
| Apache | 4.2 /100 | #230 | Tragic 94.3% |
| Immigrants | Panama | 4.0 /100 | #231 | Tragic 94.3% |
| Immigrants | Africa | 3.9 /100 | #232 | Tragic 94.3% |
| Nigerians | 3.7 /100 | #233 | Tragic 94.3% |
| Costa Ricans | 3.5 /100 | #234 | Tragic 94.3% |
| Bolivians | 3.3 /100 | #235 | Tragic 94.3% |
| Somalis | 2.9 /100 | #236 | Tragic 94.3% |
| Koreans | 2.9 /100 | #237 | Tragic 94.3% |
| South American Indians | 2.8 /100 | #238 | Tragic 94.3% |
| Immigrants | China | 2.8 /100 | #239 | Tragic 94.3% |
| Immigrants | Ethiopia | 2.7 /100 | #240 | Tragic 94.3% |
| Spanish Americans | 2.6 /100 | #241 | Tragic 94.2% |
| Immigrants | Middle Africa | 2.2 /100 | #242 | Tragic 94.2% |
| Immigrants | Cameroon | 2.1 /100 | #243 | Tragic 94.2% |
Demographics Similar to Ugandans by 9th Grade
In terms of 9th grade, the demographic groups most similar to Ugandans are Cajun (95.1%, a difference of 0.0%), Albanian (95.1%, a difference of 0.010%), Kenyan (95.1%, a difference of 0.020%), Arab (95.1%, a difference of 0.020%), and Immigrants from Kazakhstan (95.1%, a difference of 0.020%).
| Demographics | Rating | Rank | 9th Grade |
| Pueblo | 82.2 /100 | #145 | Excellent 95.1% |
| Immigrants | Sri Lanka | 82.1 /100 | #146 | Excellent 95.1% |
| Choctaw | 81.9 /100 | #147 | Excellent 95.1% |
| Immigrants | Jordan | 81.2 /100 | #148 | Excellent 95.1% |
| Immigrants | Korea | 79.6 /100 | #149 | Good 95.1% |
| Kenyans | 79.1 /100 | #150 | Good 95.1% |
| Cajuns | 77.3 /100 | #151 | Good 95.1% |
| Ugandans | 77.0 /100 | #152 | Good 95.1% |
| Albanians | 76.1 /100 | #153 | Good 95.1% |
| Arabs | 74.9 /100 | #154 | Good 95.1% |
| Immigrants | Kazakhstan | 74.7 /100 | #155 | Good 95.1% |
| Immigrants | Kenya | 73.1 /100 | #156 | Good 95.0% |
| Mongolians | 73.0 /100 | #157 | Good 95.0% |
| Egyptians | 70.1 /100 | #158 | Good 95.0% |
| Immigrants | Ukraine | 67.4 /100 | #159 | Good 95.0% |