Immigrants from Fiji vs Indonesian No Schooling Completed
COMPARE
Immigrants from Fiji
Indonesian
No Schooling Completed
No Schooling Completed Comparison
Immigrants from Fiji
Indonesians
3.5%
NO SCHOOLING COMPLETED
0.0/ 100
METRIC RATING
336th/ 347
METRIC RANK
3.2%
NO SCHOOLING COMPLETED
0.0/ 100
METRIC RATING
326th/ 347
METRIC RANK
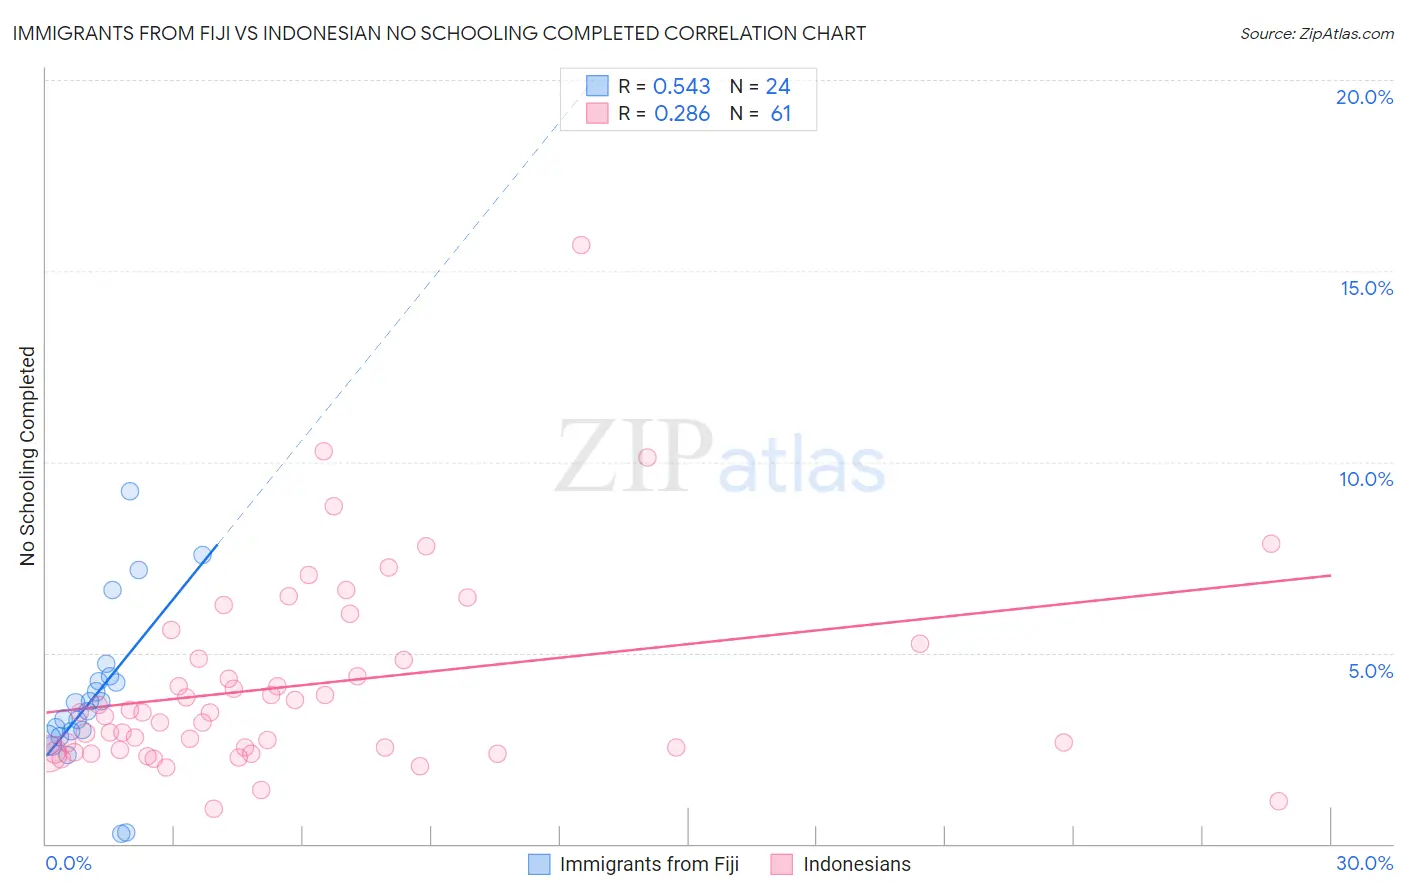
Immigrants from Fiji vs Indonesian No Schooling Completed Correlation Chart
The statistical analysis conducted on geographies consisting of 93,588,914 people shows a substantial positive correlation between the proportion of Immigrants from Fiji and percentage of population with no schooling in the United States with a correlation coefficient (R) of 0.543 and weighted average of 3.5%. Similarly, the statistical analysis conducted on geographies consisting of 162,153,140 people shows a weak positive correlation between the proportion of Indonesians and percentage of population with no schooling in the United States with a correlation coefficient (R) of 0.286 and weighted average of 3.2%, a difference of 9.3%.
No Schooling Completed Correlation Summary
| Measurement | Immigrants from Fiji | Indonesian |
| Minimum | 0.26% | 0.92% |
| Maximum | 9.2% | 15.7% |
| Range | 9.0% | 14.8% |
| Mean | 3.9% | 4.2% |
| Median | 3.6% | 3.4% |
| Interquartile 25% (IQ1) | 2.9% | 2.4% |
| Interquartile 75% (IQ3) | 4.3% | 5.0% |
| Interquartile Range (IQR) | 1.4% | 2.6% |
| Standard Deviation (Sample) | 2.1% | 2.6% |
| Standard Deviation (Population) | 2.0% | 2.6% |
Demographics Similar to Immigrants from Fiji and Indonesians by No Schooling Completed
In terms of no schooling completed, the demographic groups most similar to Immigrants from Fiji are Immigrants from Cambodia (3.5%, a difference of 0.37%), Immigrants from Cabo Verde (3.5%, a difference of 0.71%), Bangladeshi (3.5%, a difference of 0.95%), Yakama (3.6%, a difference of 1.3%), and Guatemalan (3.5%, a difference of 1.4%). Similarly, the demographic groups most similar to Indonesians are Dominican (3.2%, a difference of 0.030%), Mexican American Indian (3.2%, a difference of 0.70%), Vietnamese (3.2%, a difference of 1.1%), Immigrants from Honduras (3.2%, a difference of 1.2%), and Immigrants from Laos (3.1%, a difference of 1.9%).
| Demographics | Rating | Rank | No Schooling Completed |
| Immigrants | Laos | 0.0 /100 | #321 | Tragic 3.1% |
| Immigrants | Honduras | 0.0 /100 | #322 | Tragic 3.2% |
| Vietnamese | 0.0 /100 | #323 | Tragic 3.2% |
| Mexican American Indians | 0.0 /100 | #324 | Tragic 3.2% |
| Dominicans | 0.0 /100 | #325 | Tragic 3.2% |
| Indonesians | 0.0 /100 | #326 | Tragic 3.2% |
| Immigrants | Latin America | 0.0 /100 | #327 | Tragic 3.3% |
| Mexicans | 0.0 /100 | #328 | Tragic 3.3% |
| Immigrants | Vietnam | 0.0 /100 | #329 | Tragic 3.3% |
| Immigrants | Armenia | 0.0 /100 | #330 | Tragic 3.3% |
| Japanese | 0.0 /100 | #331 | Tragic 3.3% |
| Central Americans | 0.0 /100 | #332 | Tragic 3.4% |
| Immigrants | Dominican Republic | 0.0 /100 | #333 | Tragic 3.4% |
| Guatemalans | 0.0 /100 | #334 | Tragic 3.5% |
| Immigrants | Cambodia | 0.0 /100 | #335 | Tragic 3.5% |
| Immigrants | Fiji | 0.0 /100 | #336 | Tragic 3.5% |
| Immigrants | Cabo Verde | 0.0 /100 | #337 | Tragic 3.5% |
| Bangladeshis | 0.0 /100 | #338 | Tragic 3.5% |
| Yakama | 0.0 /100 | #339 | Tragic 3.6% |
| Immigrants | Guatemala | 0.0 /100 | #340 | Tragic 3.6% |
| Immigrants | Central America | 0.0 /100 | #341 | Tragic 3.6% |