Immigrants from Northern Europe vs Indonesian No Schooling Completed
COMPARE
Immigrants from Northern Europe
Indonesian
No Schooling Completed
No Schooling Completed Comparison
Immigrants from Northern Europe
Indonesians
1.7%
NO SCHOOLING COMPLETED
99.8/ 100
METRIC RATING
62nd/ 347
METRIC RANK
3.2%
NO SCHOOLING COMPLETED
0.0/ 100
METRIC RATING
326th/ 347
METRIC RANK
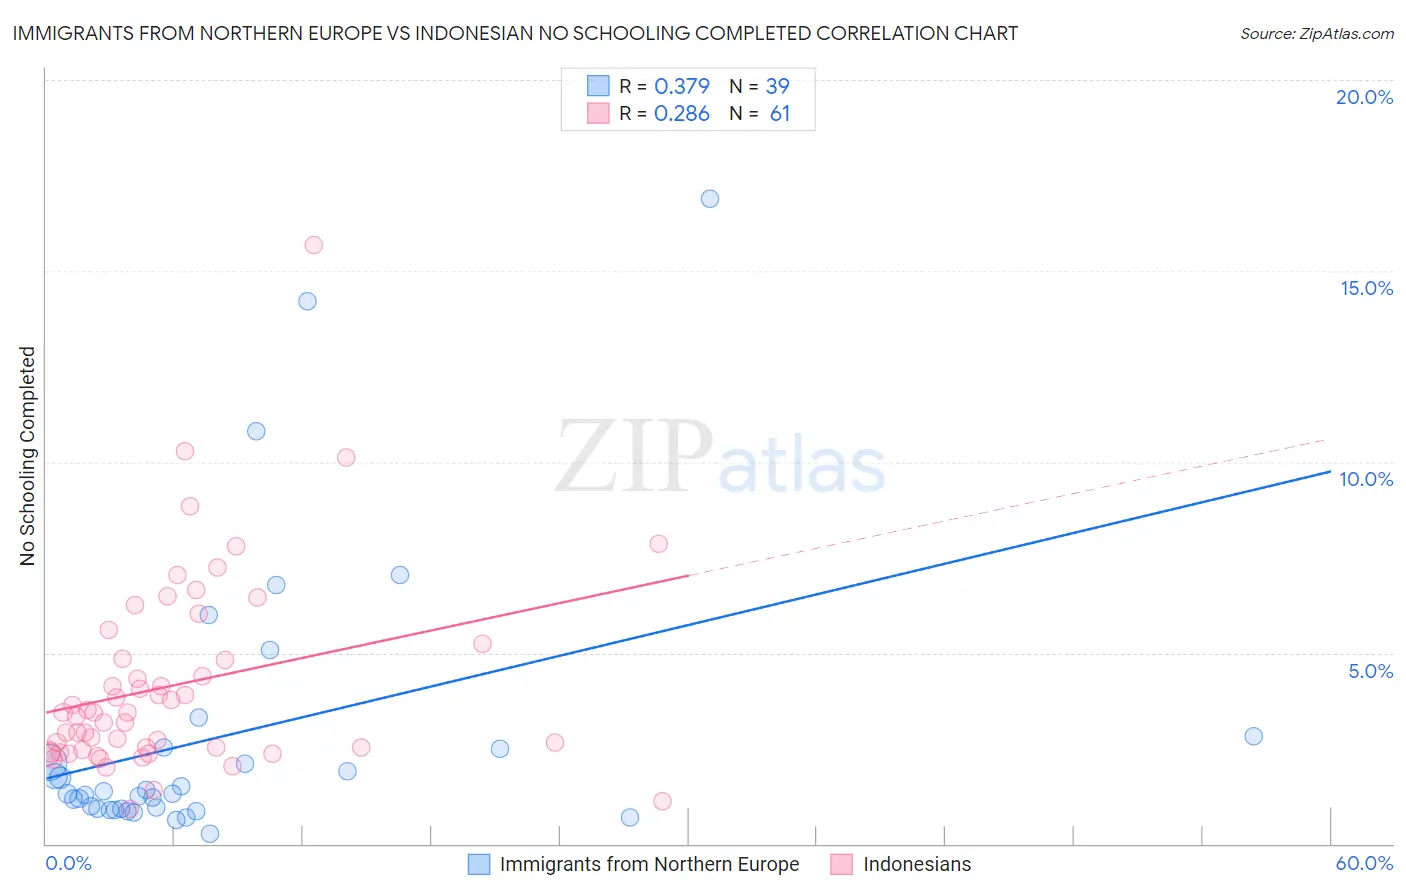
Immigrants from Northern Europe vs Indonesian No Schooling Completed Correlation Chart
The statistical analysis conducted on geographies consisting of 468,916,494 people shows a mild positive correlation between the proportion of Immigrants from Northern Europe and percentage of population with no schooling in the United States with a correlation coefficient (R) of 0.379 and weighted average of 1.7%. Similarly, the statistical analysis conducted on geographies consisting of 162,153,140 people shows a weak positive correlation between the proportion of Indonesians and percentage of population with no schooling in the United States with a correlation coefficient (R) of 0.286 and weighted average of 3.2%, a difference of 92.5%.
No Schooling Completed Correlation Summary
| Measurement | Immigrants from Northern Europe | Indonesian |
| Minimum | 0.25% | 0.92% |
| Maximum | 16.9% | 15.7% |
| Range | 16.7% | 14.8% |
| Mean | 2.8% | 4.2% |
| Median | 1.3% | 3.4% |
| Interquartile 25% (IQ1) | 0.91% | 2.4% |
| Interquartile 75% (IQ3) | 2.5% | 5.0% |
| Interquartile Range (IQR) | 1.6% | 2.6% |
| Standard Deviation (Sample) | 3.7% | 2.6% |
| Standard Deviation (Population) | 3.7% | 2.6% |
Similar Demographics by No Schooling Completed
Demographics Similar to Immigrants from Northern Europe by No Schooling Completed
In terms of no schooling completed, the demographic groups most similar to Immigrants from Northern Europe are Russian (1.7%, a difference of 0.040%), New Zealander (1.7%, a difference of 0.20%), Serbian (1.7%, a difference of 0.24%), Canadian (1.7%, a difference of 0.38%), and Immigrants from Austria (1.7%, a difference of 0.57%).
| Demographics | Rating | Rank | No Schooling Completed |
| Greeks | 99.8 /100 | #55 | Exceptional 1.6% |
| Immigrants | North America | 99.8 /100 | #56 | Exceptional 1.6% |
| Austrians | 99.8 /100 | #57 | Exceptional 1.6% |
| Kiowa | 99.8 /100 | #58 | Exceptional 1.6% |
| Slavs | 99.8 /100 | #59 | Exceptional 1.7% |
| Americans | 99.8 /100 | #60 | Exceptional 1.7% |
| Tsimshian | 99.8 /100 | #61 | Exceptional 1.7% |
| Immigrants | Northern Europe | 99.8 /100 | #62 | Exceptional 1.7% |
| Russians | 99.8 /100 | #63 | Exceptional 1.7% |
| New Zealanders | 99.7 /100 | #64 | Exceptional 1.7% |
| Serbians | 99.7 /100 | #65 | Exceptional 1.7% |
| Canadians | 99.7 /100 | #66 | Exceptional 1.7% |
| Immigrants | Austria | 99.7 /100 | #67 | Exceptional 1.7% |
| Immigrants | Lithuania | 99.7 /100 | #68 | Exceptional 1.7% |
| Chickasaw | 99.6 /100 | #69 | Exceptional 1.7% |
Demographics Similar to Indonesians by No Schooling Completed
In terms of no schooling completed, the demographic groups most similar to Indonesians are Dominican (3.2%, a difference of 0.030%), Mexican American Indian (3.2%, a difference of 0.70%), Vietnamese (3.2%, a difference of 1.1%), Immigrants from Honduras (3.2%, a difference of 1.2%), and Immigrants from Laos (3.1%, a difference of 1.9%).
| Demographics | Rating | Rank | No Schooling Completed |
| Immigrants | Burma/Myanmar | 0.0 /100 | #319 | Tragic 3.1% |
| Immigrants | Bangladesh | 0.0 /100 | #320 | Tragic 3.1% |
| Immigrants | Laos | 0.0 /100 | #321 | Tragic 3.1% |
| Immigrants | Honduras | 0.0 /100 | #322 | Tragic 3.2% |
| Vietnamese | 0.0 /100 | #323 | Tragic 3.2% |
| Mexican American Indians | 0.0 /100 | #324 | Tragic 3.2% |
| Dominicans | 0.0 /100 | #325 | Tragic 3.2% |
| Indonesians | 0.0 /100 | #326 | Tragic 3.2% |
| Immigrants | Latin America | 0.0 /100 | #327 | Tragic 3.3% |
| Mexicans | 0.0 /100 | #328 | Tragic 3.3% |
| Immigrants | Vietnam | 0.0 /100 | #329 | Tragic 3.3% |
| Immigrants | Armenia | 0.0 /100 | #330 | Tragic 3.3% |
| Japanese | 0.0 /100 | #331 | Tragic 3.3% |
| Central Americans | 0.0 /100 | #332 | Tragic 3.4% |
| Immigrants | Dominican Republic | 0.0 /100 | #333 | Tragic 3.4% |