Houma vs Dominican Master's Degree
COMPARE
Houma
Dominican
Master's Degree
Master's Degree Comparison
Houma
Dominicans
7.9%
MASTER'S DEGREE
0.0/ 100
METRIC RATING
347th/ 347
METRIC RANK
12.5%
MASTER'S DEGREE
0.6/ 100
METRIC RATING
260th/ 347
METRIC RANK
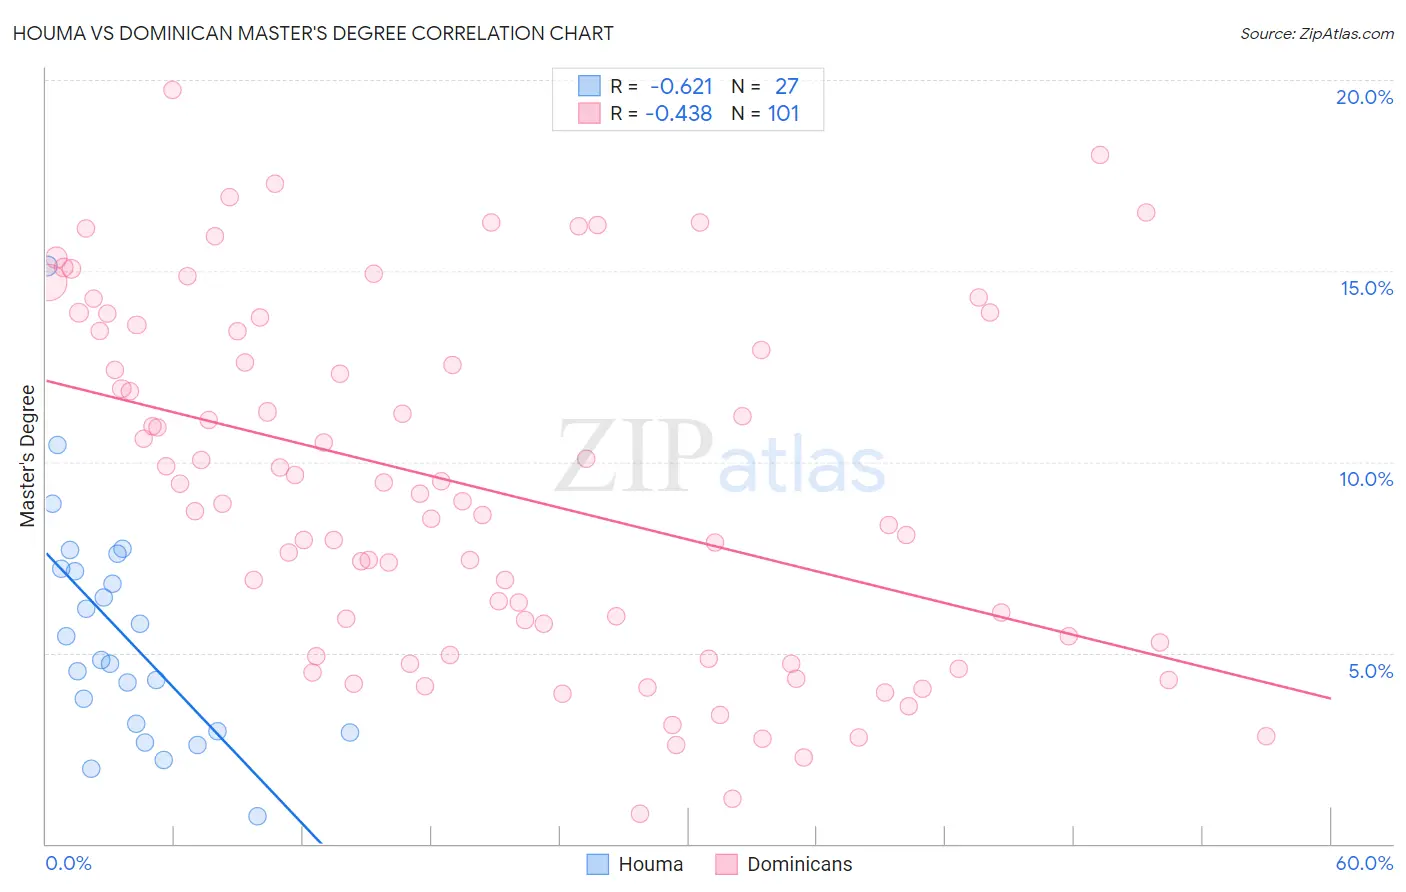
Houma vs Dominican Master's Degree Correlation Chart
The statistical analysis conducted on geographies consisting of 36,787,451 people shows a significant negative correlation between the proportion of Houma and percentage of population with at least master's degree education in the United States with a correlation coefficient (R) of -0.621 and weighted average of 7.9%. Similarly, the statistical analysis conducted on geographies consisting of 354,930,218 people shows a moderate negative correlation between the proportion of Dominicans and percentage of population with at least master's degree education in the United States with a correlation coefficient (R) of -0.438 and weighted average of 12.5%, a difference of 57.9%.
Master's Degree Correlation Summary
| Measurement | Houma | Dominican |
| Minimum | 0.74% | 0.79% |
| Maximum | 15.1% | 19.7% |
| Range | 14.4% | 18.9% |
| Mean | 5.5% | 9.3% |
| Median | 4.8% | 9.0% |
| Interquartile 25% (IQ1) | 3.0% | 5.1% |
| Interquartile 75% (IQ3) | 7.2% | 13.4% |
| Interquartile Range (IQR) | 4.2% | 8.3% |
| Standard Deviation (Sample) | 3.0% | 4.6% |
| Standard Deviation (Population) | 3.0% | 4.5% |
Similar Demographics by Master's Degree
Demographics Similar to Houma by Master's Degree
In terms of master's degree, the demographic groups most similar to Houma are Yup'ik (8.5%, a difference of 8.0%), Yuman (9.2%, a difference of 16.7%), Pima (9.2%, a difference of 16.9%), Lumbee (9.3%, a difference of 17.1%), and Immigrants from Mexico (9.3%, a difference of 17.6%).
| Demographics | Rating | Rank | Master's Degree |
| Menominee | 0.0 /100 | #333 | Tragic 10.2% |
| Arapaho | 0.0 /100 | #334 | Tragic 10.0% |
| Immigrants | Central America | 0.0 /100 | #335 | Tragic 10.0% |
| Natives/Alaskans | 0.0 /100 | #336 | Tragic 9.9% |
| Mexicans | 0.0 /100 | #337 | Tragic 9.7% |
| Tohono O'odham | 0.0 /100 | #338 | Tragic 9.7% |
| Spanish American Indians | 0.0 /100 | #339 | Tragic 9.6% |
| Yakama | 0.0 /100 | #340 | Tragic 9.5% |
| Navajo | 0.0 /100 | #341 | Tragic 9.4% |
| Immigrants | Mexico | 0.0 /100 | #342 | Tragic 9.3% |
| Lumbee | 0.0 /100 | #343 | Tragic 9.3% |
| Pima | 0.0 /100 | #344 | Tragic 9.2% |
| Yuman | 0.0 /100 | #345 | Tragic 9.2% |
| Yup'ik | 0.0 /100 | #346 | Tragic 8.5% |
| Houma | 0.0 /100 | #347 | Tragic 7.9% |
Demographics Similar to Dominicans by Master's Degree
In terms of master's degree, the demographic groups most similar to Dominicans are Japanese (12.5%, a difference of 0.010%), Tongan (12.5%, a difference of 0.040%), Immigrants from Liberia (12.5%, a difference of 0.10%), Nicaraguan (12.5%, a difference of 0.22%), and Central American Indian (12.4%, a difference of 0.46%).
| Demographics | Rating | Rank | Master's Degree |
| Immigrants | Dominica | 0.8 /100 | #253 | Tragic 12.6% |
| Indonesians | 0.8 /100 | #254 | Tragic 12.6% |
| Immigrants | Congo | 0.8 /100 | #255 | Tragic 12.6% |
| Immigrants | Portugal | 0.8 /100 | #256 | Tragic 12.6% |
| Osage | 0.7 /100 | #257 | Tragic 12.6% |
| Immigrants | Liberia | 0.6 /100 | #258 | Tragic 12.5% |
| Japanese | 0.6 /100 | #259 | Tragic 12.5% |
| Dominicans | 0.6 /100 | #260 | Tragic 12.5% |
| Tongans | 0.6 /100 | #261 | Tragic 12.5% |
| Nicaraguans | 0.6 /100 | #262 | Tragic 12.5% |
| Central American Indians | 0.5 /100 | #263 | Tragic 12.4% |
| Belizeans | 0.5 /100 | #264 | Tragic 12.4% |
| Immigrants | Fiji | 0.5 /100 | #265 | Tragic 12.4% |
| Bahamians | 0.5 /100 | #266 | Tragic 12.4% |
| Americans | 0.4 /100 | #267 | Tragic 12.3% |