Houma vs Spaniard Master's Degree
COMPARE
Houma
Spaniard
Master's Degree
Master's Degree Comparison
Houma
Spaniards
7.9%
MASTER'S DEGREE
0.0/ 100
METRIC RATING
347th/ 347
METRIC RANK
14.6%
MASTER'S DEGREE
35.8/ 100
METRIC RATING
190th/ 347
METRIC RANK
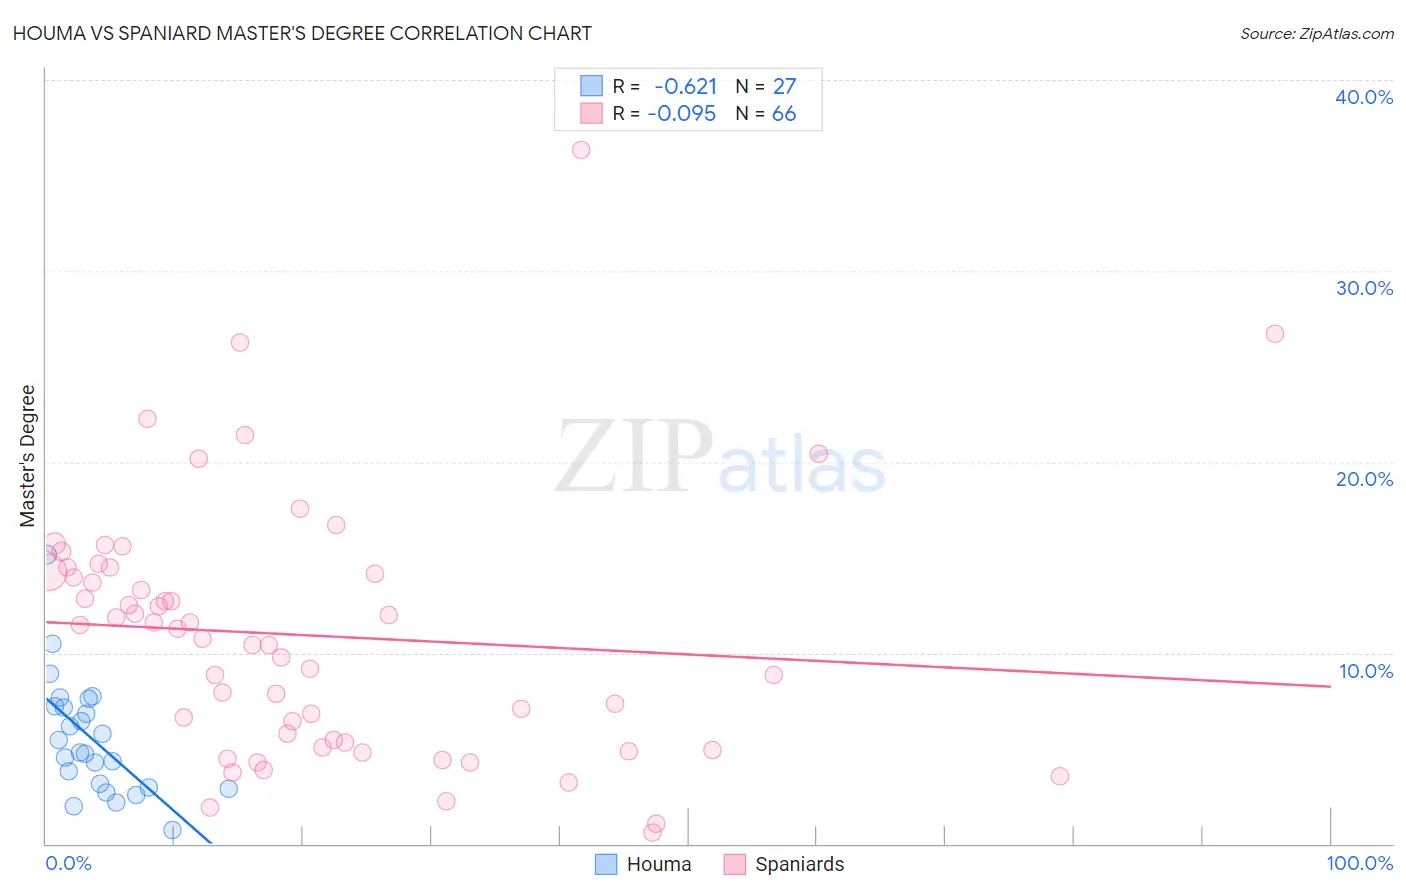
Houma vs Spaniard Master's Degree Correlation Chart
The statistical analysis conducted on geographies consisting of 36,787,451 people shows a significant negative correlation between the proportion of Houma and percentage of population with at least master's degree education in the United States with a correlation coefficient (R) of -0.621 and weighted average of 7.9%. Similarly, the statistical analysis conducted on geographies consisting of 443,325,255 people shows a slight negative correlation between the proportion of Spaniards and percentage of population with at least master's degree education in the United States with a correlation coefficient (R) of -0.095 and weighted average of 14.6%, a difference of 85.0%.
Master's Degree Correlation Summary
| Measurement | Houma | Spaniard |
| Minimum | 0.74% | 0.56% |
| Maximum | 15.1% | 36.4% |
| Range | 14.4% | 35.8% |
| Mean | 5.5% | 10.9% |
| Median | 4.8% | 11.0% |
| Interquartile 25% (IQ1) | 3.0% | 5.3% |
| Interquartile 75% (IQ3) | 7.2% | 14.2% |
| Interquartile Range (IQR) | 4.2% | 8.9% |
| Standard Deviation (Sample) | 3.0% | 6.7% |
| Standard Deviation (Population) | 3.0% | 6.6% |
Similar Demographics by Master's Degree
Demographics Similar to Houma by Master's Degree
In terms of master's degree, the demographic groups most similar to Houma are Yup'ik (8.5%, a difference of 8.0%), Yuman (9.2%, a difference of 16.7%), Pima (9.2%, a difference of 16.9%), Lumbee (9.3%, a difference of 17.1%), and Immigrants from Mexico (9.3%, a difference of 17.6%).
| Demographics | Rating | Rank | Master's Degree |
| Menominee | 0.0 /100 | #333 | Tragic 10.2% |
| Arapaho | 0.0 /100 | #334 | Tragic 10.0% |
| Immigrants | Central America | 0.0 /100 | #335 | Tragic 10.0% |
| Natives/Alaskans | 0.0 /100 | #336 | Tragic 9.9% |
| Mexicans | 0.0 /100 | #337 | Tragic 9.7% |
| Tohono O'odham | 0.0 /100 | #338 | Tragic 9.7% |
| Spanish American Indians | 0.0 /100 | #339 | Tragic 9.6% |
| Yakama | 0.0 /100 | #340 | Tragic 9.5% |
| Navajo | 0.0 /100 | #341 | Tragic 9.4% |
| Immigrants | Mexico | 0.0 /100 | #342 | Tragic 9.3% |
| Lumbee | 0.0 /100 | #343 | Tragic 9.3% |
| Pima | 0.0 /100 | #344 | Tragic 9.2% |
| Yuman | 0.0 /100 | #345 | Tragic 9.2% |
| Yup'ik | 0.0 /100 | #346 | Tragic 8.5% |
| Houma | 0.0 /100 | #347 | Tragic 7.9% |
Demographics Similar to Spaniards by Master's Degree
In terms of master's degree, the demographic groups most similar to Spaniards are Immigrants (14.6%, a difference of 0.020%), Immigrants from Costa Rica (14.7%, a difference of 0.060%), Basque (14.7%, a difference of 0.10%), Immigrants from Oceania (14.7%, a difference of 0.19%), and Welsh (14.6%, a difference of 0.23%).
| Demographics | Rating | Rank | Master's Degree |
| Sri Lankans | 39.6 /100 | #183 | Fair 14.7% |
| Immigrants | Zaire | 39.5 /100 | #184 | Fair 14.7% |
| Barbadians | 38.3 /100 | #185 | Fair 14.7% |
| Immigrants | Oceania | 37.1 /100 | #186 | Fair 14.7% |
| Basques | 36.5 /100 | #187 | Fair 14.7% |
| Immigrants | Costa Rica | 36.2 /100 | #188 | Fair 14.7% |
| Immigrants | Immigrants | 36.0 /100 | #189 | Fair 14.6% |
| Spaniards | 35.8 /100 | #190 | Fair 14.6% |
| Welsh | 34.2 /100 | #191 | Fair 14.6% |
| Immigrants | Middle Africa | 33.6 /100 | #192 | Fair 14.6% |
| Immigrants | Nigeria | 32.7 /100 | #193 | Fair 14.6% |
| Chinese | 32.5 /100 | #194 | Fair 14.6% |
| Danes | 31.3 /100 | #195 | Fair 14.5% |
| Czechoslovakians | 29.9 /100 | #196 | Fair 14.5% |
| Belgians | 28.0 /100 | #197 | Fair 14.5% |