Houma vs Zimbabwean Family Households
COMPARE
Houma
Zimbabwean
Family Households
Family Households Comparison
Houma
Zimbabweans
65.7%
FAMILY HOUSEHOLDS
99.9/ 100
METRIC RATING
75th/ 347
METRIC RANK
64.1%
FAMILY HOUSEHOLDS
24.7/ 100
METRIC RATING
190th/ 347
METRIC RANK
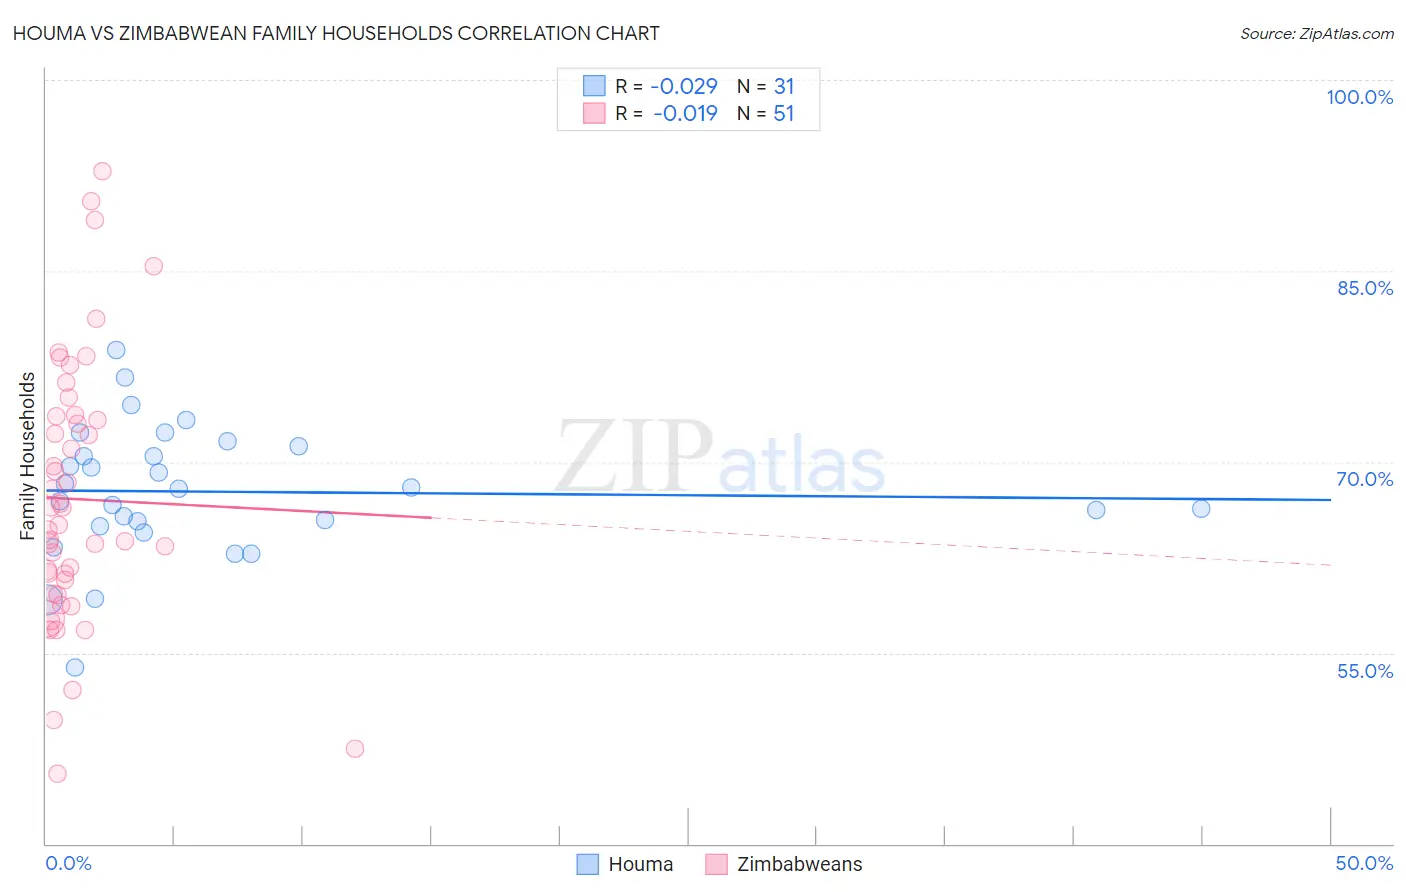
Houma vs Zimbabwean Family Households Correlation Chart
The statistical analysis conducted on geographies consisting of 36,793,599 people shows no correlation between the proportion of Houma and percentage of family households in the United States with a correlation coefficient (R) of -0.029 and weighted average of 65.7%. Similarly, the statistical analysis conducted on geographies consisting of 69,192,017 people shows no correlation between the proportion of Zimbabweans and percentage of family households in the United States with a correlation coefficient (R) of -0.019 and weighted average of 64.1%, a difference of 2.6%.
Family Households Correlation Summary
| Measurement | Houma | Zimbabwean |
| Minimum | 53.8% | 45.5% |
| Maximum | 78.8% | 92.9% |
| Range | 25.0% | 47.3% |
| Mean | 67.7% | 67.1% |
| Median | 67.8% | 65.0% |
| Interquartile 25% (IQ1) | 65.0% | 59.7% |
| Interquartile 75% (IQ3) | 71.2% | 73.6% |
| Interquartile Range (IQR) | 6.3% | 13.9% |
| Standard Deviation (Sample) | 5.2% | 10.5% |
| Standard Deviation (Population) | 5.1% | 10.4% |
Similar Demographics by Family Households
Demographics Similar to Houma by Family Households
In terms of family households, the demographic groups most similar to Houma are Burmese (65.7%, a difference of 0.050%), Laotian (65.8%, a difference of 0.090%), Immigrants from the Azores (65.6%, a difference of 0.12%), Immigrants from South America (65.6%, a difference of 0.12%), and Yaqui (65.6%, a difference of 0.12%).
| Demographics | Rating | Rank | Family Households |
| Japanese | 99.9 /100 | #68 | Exceptional 65.9% |
| Malaysians | 99.9 /100 | #69 | Exceptional 65.9% |
| Immigrants | Afghanistan | 99.9 /100 | #70 | Exceptional 65.9% |
| Bhutanese | 99.9 /100 | #71 | Exceptional 65.9% |
| Portuguese | 99.9 /100 | #72 | Exceptional 65.8% |
| Laotians | 99.9 /100 | #73 | Exceptional 65.8% |
| Burmese | 99.9 /100 | #74 | Exceptional 65.7% |
| Houma | 99.9 /100 | #75 | Exceptional 65.7% |
| Immigrants | Azores | 99.8 /100 | #76 | Exceptional 65.6% |
| Immigrants | South America | 99.8 /100 | #77 | Exceptional 65.6% |
| Yaqui | 99.8 /100 | #78 | Exceptional 65.6% |
| Immigrants | Costa Rica | 99.8 /100 | #79 | Exceptional 65.6% |
| Puget Sound Salish | 99.8 /100 | #80 | Exceptional 65.6% |
| Jordanians | 99.7 /100 | #81 | Exceptional 65.5% |
| Immigrants | Lebanon | 99.7 /100 | #82 | Exceptional 65.5% |
Demographics Similar to Zimbabweans by Family Households
In terms of family households, the demographic groups most similar to Zimbabweans are Arab (64.1%, a difference of 0.0%), Immigrants from Western Asia (64.1%, a difference of 0.010%), Lithuanian (64.0%, a difference of 0.020%), French (64.0%, a difference of 0.020%), and Paraguayan (64.1%, a difference of 0.040%).
| Demographics | Rating | Rank | Family Households |
| Creek | 34.1 /100 | #183 | Fair 64.2% |
| Puerto Ricans | 33.4 /100 | #184 | Fair 64.2% |
| Immigrants | Iran | 30.4 /100 | #185 | Fair 64.1% |
| Spanish Americans | 30.1 /100 | #186 | Fair 64.1% |
| Northern Europeans | 28.2 /100 | #187 | Fair 64.1% |
| Paraguayans | 26.7 /100 | #188 | Fair 64.1% |
| Immigrants | Western Asia | 25.3 /100 | #189 | Fair 64.1% |
| Zimbabweans | 24.7 /100 | #190 | Fair 64.1% |
| Arabs | 24.5 /100 | #191 | Fair 64.1% |
| Lithuanians | 23.8 /100 | #192 | Fair 64.0% |
| French | 23.7 /100 | #193 | Fair 64.0% |
| Paiute | 22.2 /100 | #194 | Fair 64.0% |
| Immigrants | North America | 20.0 /100 | #195 | Poor 64.0% |
| Immigrants | Canada | 19.2 /100 | #196 | Poor 64.0% |
| Seminole | 18.9 /100 | #197 | Poor 64.0% |