Zimbabwean vs Immigrants from Laos High School Diploma
COMPARE
Zimbabwean
Immigrants from Laos
High School Diploma
High School Diploma Comparison
Zimbabweans
Immigrants from Laos
91.1%
HIGH SCHOOL DIPLOMA
99.7/ 100
METRIC RATING
57th/ 347
METRIC RANK
86.6%
HIGH SCHOOL DIPLOMA
0.0/ 100
METRIC RATING
279th/ 347
METRIC RANK
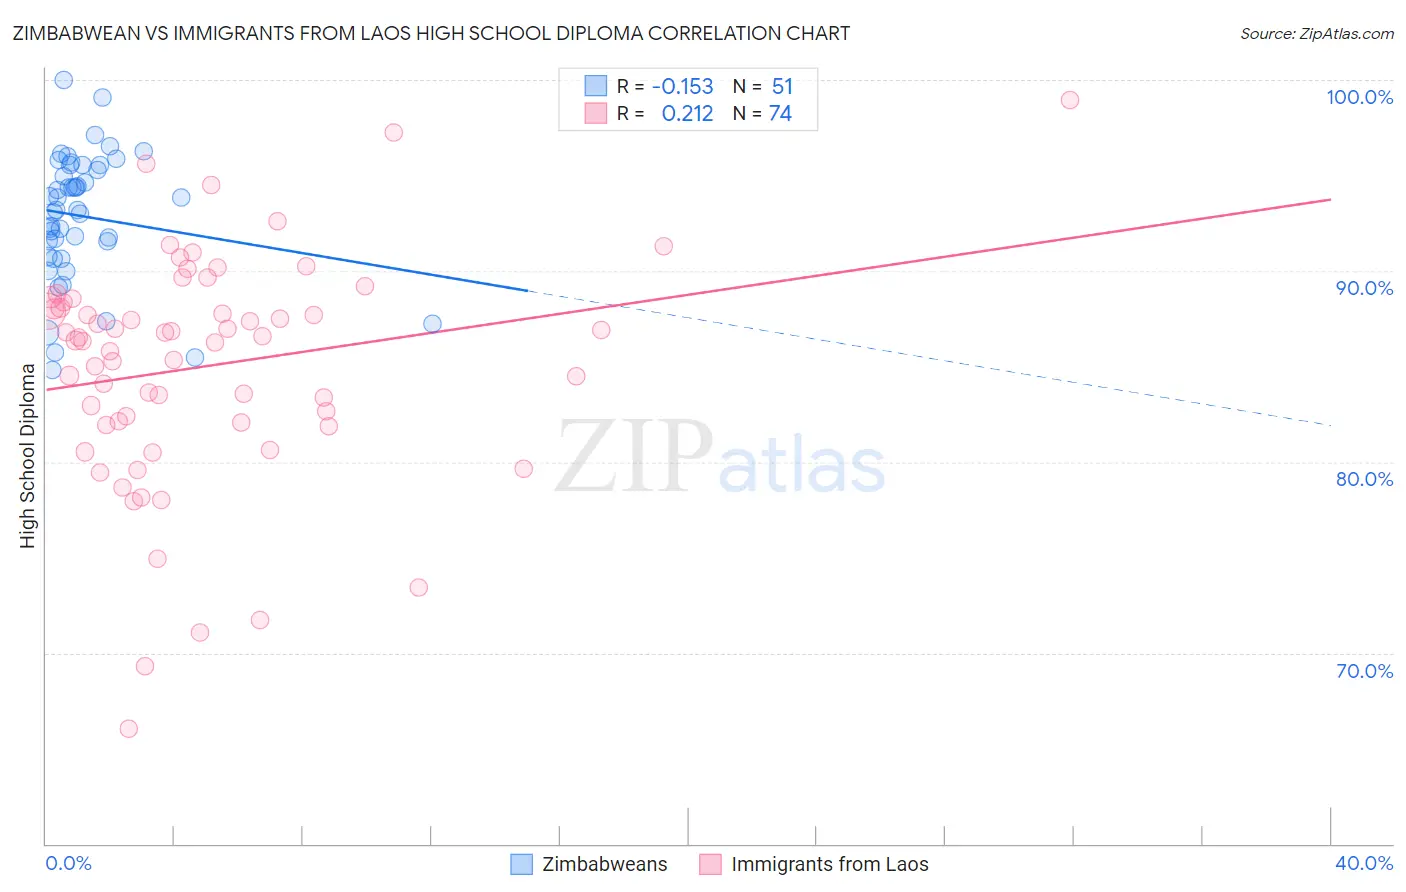
Zimbabwean vs Immigrants from Laos High School Diploma Correlation Chart
The statistical analysis conducted on geographies consisting of 69,203,423 people shows a poor negative correlation between the proportion of Zimbabweans and percentage of population with at least high school diploma education in the United States with a correlation coefficient (R) of -0.153 and weighted average of 91.1%. Similarly, the statistical analysis conducted on geographies consisting of 201,472,886 people shows a weak positive correlation between the proportion of Immigrants from Laos and percentage of population with at least high school diploma education in the United States with a correlation coefficient (R) of 0.212 and weighted average of 86.6%, a difference of 5.2%.
High School Diploma Correlation Summary
| Measurement | Zimbabwean | Immigrants from Laos |
| Minimum | 84.8% | 66.0% |
| Maximum | 100.0% | 98.9% |
| Range | 15.2% | 32.9% |
| Mean | 92.9% | 85.0% |
| Median | 93.2% | 86.4% |
| Interquartile 25% (IQ1) | 90.8% | 82.0% |
| Interquartile 75% (IQ3) | 95.5% | 88.4% |
| Interquartile Range (IQR) | 4.8% | 6.3% |
| Standard Deviation (Sample) | 3.4% | 6.0% |
| Standard Deviation (Population) | 3.3% | 6.0% |
Similar Demographics by High School Diploma
Demographics Similar to Zimbabweans by High School Diploma
In terms of high school diploma, the demographic groups most similar to Zimbabweans are Slavic (91.0%, a difference of 0.010%), Immigrants from North America (91.0%, a difference of 0.010%), Immigrants from Canada (91.1%, a difference of 0.020%), Immigrants from Japan (91.0%, a difference of 0.040%), and Serbian (91.1%, a difference of 0.050%).
| Demographics | Rating | Rank | High School Diploma |
| Welsh | 99.8 /100 | #50 | Exceptional 91.2% |
| New Zealanders | 99.7 /100 | #51 | Exceptional 91.1% |
| Immigrants | Sweden | 99.7 /100 | #52 | Exceptional 91.1% |
| Immigrants | Belgium | 99.7 /100 | #53 | Exceptional 91.1% |
| Macedonians | 99.7 /100 | #54 | Exceptional 91.1% |
| Serbians | 99.7 /100 | #55 | Exceptional 91.1% |
| Immigrants | Canada | 99.7 /100 | #56 | Exceptional 91.1% |
| Zimbabweans | 99.7 /100 | #57 | Exceptional 91.1% |
| Slavs | 99.7 /100 | #58 | Exceptional 91.0% |
| Immigrants | North America | 99.7 /100 | #59 | Exceptional 91.0% |
| Immigrants | Japan | 99.6 /100 | #60 | Exceptional 91.0% |
| Immigrants | Taiwan | 99.6 /100 | #61 | Exceptional 91.0% |
| Austrians | 99.6 /100 | #62 | Exceptional 91.0% |
| Immigrants | Netherlands | 99.6 /100 | #63 | Exceptional 91.0% |
| Ukrainians | 99.6 /100 | #64 | Exceptional 91.0% |
Demographics Similar to Immigrants from Laos by High School Diploma
In terms of high school diploma, the demographic groups most similar to Immigrants from Laos are Pueblo (86.5%, a difference of 0.020%), Hopi (86.6%, a difference of 0.050%), Indonesian (86.5%, a difference of 0.070%), Dutch West Indian (86.5%, a difference of 0.11%), and Barbadian (86.7%, a difference of 0.15%).
| Demographics | Rating | Rank | High School Diploma |
| Trinidadians and Tobagonians | 0.1 /100 | #272 | Tragic 86.9% |
| Immigrants | Jamaica | 0.1 /100 | #273 | Tragic 86.9% |
| Bangladeshis | 0.1 /100 | #274 | Tragic 86.9% |
| Immigrants | Trinidad and Tobago | 0.1 /100 | #275 | Tragic 86.8% |
| Immigrants | Burma/Myanmar | 0.1 /100 | #276 | Tragic 86.7% |
| Barbadians | 0.1 /100 | #277 | Tragic 86.7% |
| Hopi | 0.1 /100 | #278 | Tragic 86.6% |
| Immigrants | Laos | 0.0 /100 | #279 | Tragic 86.6% |
| Pueblo | 0.0 /100 | #280 | Tragic 86.5% |
| Indonesians | 0.0 /100 | #281 | Tragic 86.5% |
| Dutch West Indians | 0.0 /100 | #282 | Tragic 86.5% |
| Immigrants | Barbados | 0.0 /100 | #283 | Tragic 86.4% |
| Paiute | 0.0 /100 | #284 | Tragic 86.4% |
| Immigrants | West Indies | 0.0 /100 | #285 | Tragic 86.2% |
| Immigrants | St. Vincent and the Grenadines | 0.0 /100 | #286 | Tragic 86.2% |