Cypriot vs Immigrants from Laos High School Diploma
COMPARE
Cypriot
Immigrants from Laos
High School Diploma
High School Diploma Comparison
Cypriots
Immigrants from Laos
91.5%
HIGH SCHOOL DIPLOMA
99.9/ 100
METRIC RATING
27th/ 347
METRIC RANK
86.6%
HIGH SCHOOL DIPLOMA
0.0/ 100
METRIC RATING
279th/ 347
METRIC RANK
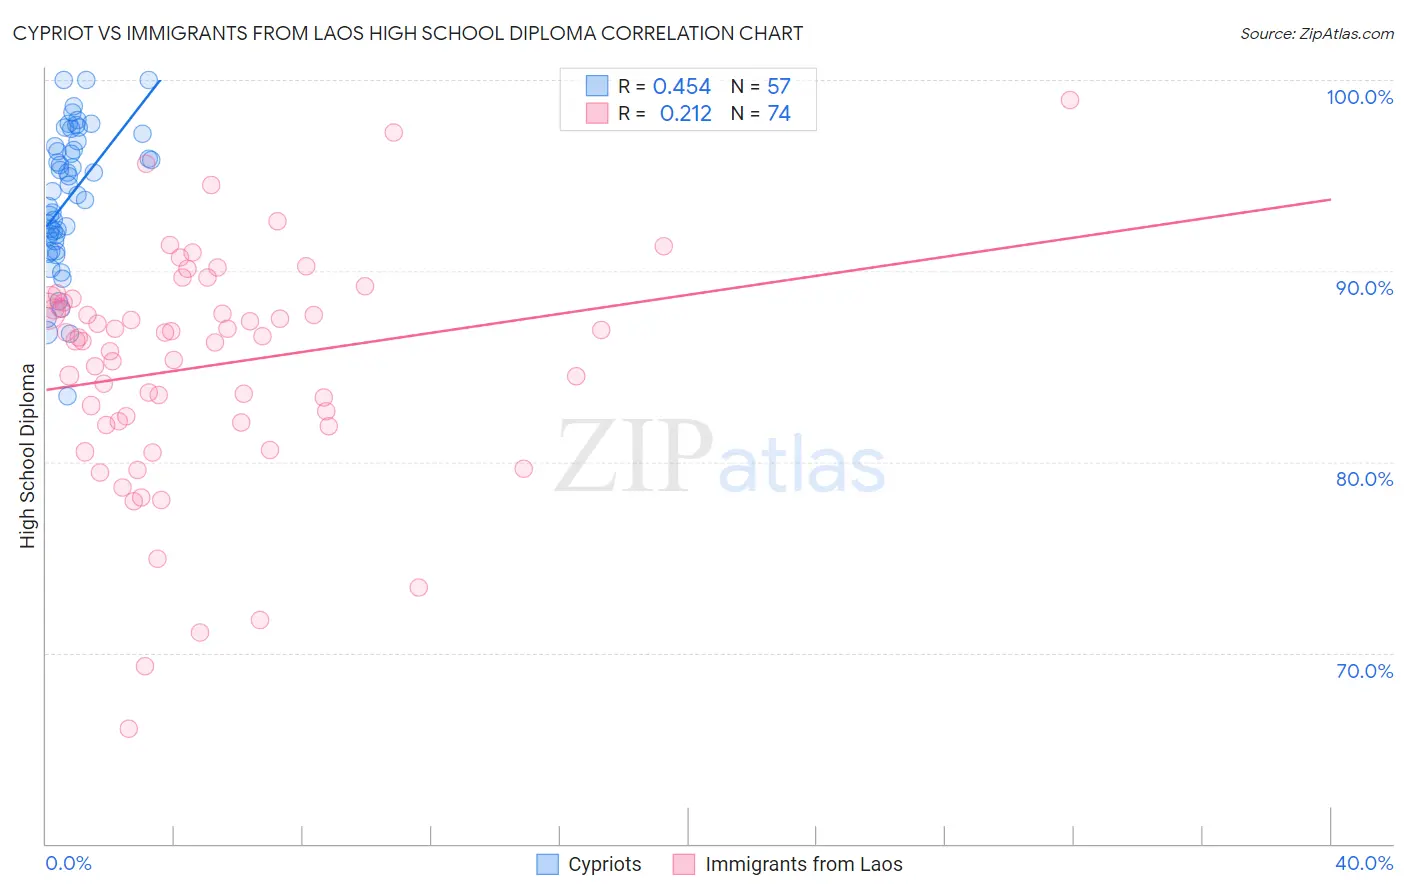
Cypriot vs Immigrants from Laos High School Diploma Correlation Chart
The statistical analysis conducted on geographies consisting of 61,870,289 people shows a moderate positive correlation between the proportion of Cypriots and percentage of population with at least high school diploma education in the United States with a correlation coefficient (R) of 0.454 and weighted average of 91.5%. Similarly, the statistical analysis conducted on geographies consisting of 201,472,886 people shows a weak positive correlation between the proportion of Immigrants from Laos and percentage of population with at least high school diploma education in the United States with a correlation coefficient (R) of 0.212 and weighted average of 86.6%, a difference of 5.7%.
High School Diploma Correlation Summary
| Measurement | Cypriot | Immigrants from Laos |
| Minimum | 83.4% | 66.0% |
| Maximum | 100.0% | 98.9% |
| Range | 16.6% | 32.9% |
| Mean | 93.9% | 85.0% |
| Median | 94.2% | 86.4% |
| Interquartile 25% (IQ1) | 91.7% | 82.0% |
| Interquartile 75% (IQ3) | 96.7% | 88.4% |
| Interquartile Range (IQR) | 5.0% | 6.3% |
| Standard Deviation (Sample) | 3.7% | 6.0% |
| Standard Deviation (Population) | 3.6% | 6.0% |
Similar Demographics by High School Diploma
Demographics Similar to Cypriots by High School Diploma
In terms of high school diploma, the demographic groups most similar to Cypriots are Russian (91.5%, a difference of 0.010%), Tlingit-Haida (91.4%, a difference of 0.030%), European (91.4%, a difference of 0.050%), Thai (91.5%, a difference of 0.060%), and Iranian (91.4%, a difference of 0.060%).
| Demographics | Rating | Rank | High School Diploma |
| Czechs | 99.9 /100 | #20 | Exceptional 91.6% |
| Filipinos | 99.9 /100 | #21 | Exceptional 91.6% |
| Estonians | 99.9 /100 | #22 | Exceptional 91.6% |
| Scandinavians | 99.9 /100 | #23 | Exceptional 91.5% |
| Italians | 99.9 /100 | #24 | Exceptional 91.5% |
| Thais | 99.9 /100 | #25 | Exceptional 91.5% |
| Russians | 99.9 /100 | #26 | Exceptional 91.5% |
| Cypriots | 99.9 /100 | #27 | Exceptional 91.5% |
| Tlingit-Haida | 99.9 /100 | #28 | Exceptional 91.4% |
| Europeans | 99.9 /100 | #29 | Exceptional 91.4% |
| Iranians | 99.9 /100 | #30 | Exceptional 91.4% |
| Immigrants | Northern Europe | 99.9 /100 | #31 | Exceptional 91.4% |
| English | 99.9 /100 | #32 | Exceptional 91.4% |
| Okinawans | 99.9 /100 | #33 | Exceptional 91.4% |
| Scottish | 99.9 /100 | #34 | Exceptional 91.4% |
Demographics Similar to Immigrants from Laos by High School Diploma
In terms of high school diploma, the demographic groups most similar to Immigrants from Laos are Pueblo (86.5%, a difference of 0.020%), Hopi (86.6%, a difference of 0.050%), Indonesian (86.5%, a difference of 0.070%), Dutch West Indian (86.5%, a difference of 0.11%), and Barbadian (86.7%, a difference of 0.15%).
| Demographics | Rating | Rank | High School Diploma |
| Trinidadians and Tobagonians | 0.1 /100 | #272 | Tragic 86.9% |
| Immigrants | Jamaica | 0.1 /100 | #273 | Tragic 86.9% |
| Bangladeshis | 0.1 /100 | #274 | Tragic 86.9% |
| Immigrants | Trinidad and Tobago | 0.1 /100 | #275 | Tragic 86.8% |
| Immigrants | Burma/Myanmar | 0.1 /100 | #276 | Tragic 86.7% |
| Barbadians | 0.1 /100 | #277 | Tragic 86.7% |
| Hopi | 0.1 /100 | #278 | Tragic 86.6% |
| Immigrants | Laos | 0.0 /100 | #279 | Tragic 86.6% |
| Pueblo | 0.0 /100 | #280 | Tragic 86.5% |
| Indonesians | 0.0 /100 | #281 | Tragic 86.5% |
| Dutch West Indians | 0.0 /100 | #282 | Tragic 86.5% |
| Immigrants | Barbados | 0.0 /100 | #283 | Tragic 86.4% |
| Paiute | 0.0 /100 | #284 | Tragic 86.4% |
| Immigrants | West Indies | 0.0 /100 | #285 | Tragic 86.2% |
| Immigrants | St. Vincent and the Grenadines | 0.0 /100 | #286 | Tragic 86.2% |