Bahamian vs Immigrants from Laos High School Diploma
COMPARE
Bahamian
Immigrants from Laos
High School Diploma
High School Diploma Comparison
Bahamians
Immigrants from Laos
87.5%
HIGH SCHOOL DIPLOMA
0.7/ 100
METRIC RATING
257th/ 347
METRIC RANK
86.6%
HIGH SCHOOL DIPLOMA
0.0/ 100
METRIC RATING
279th/ 347
METRIC RANK
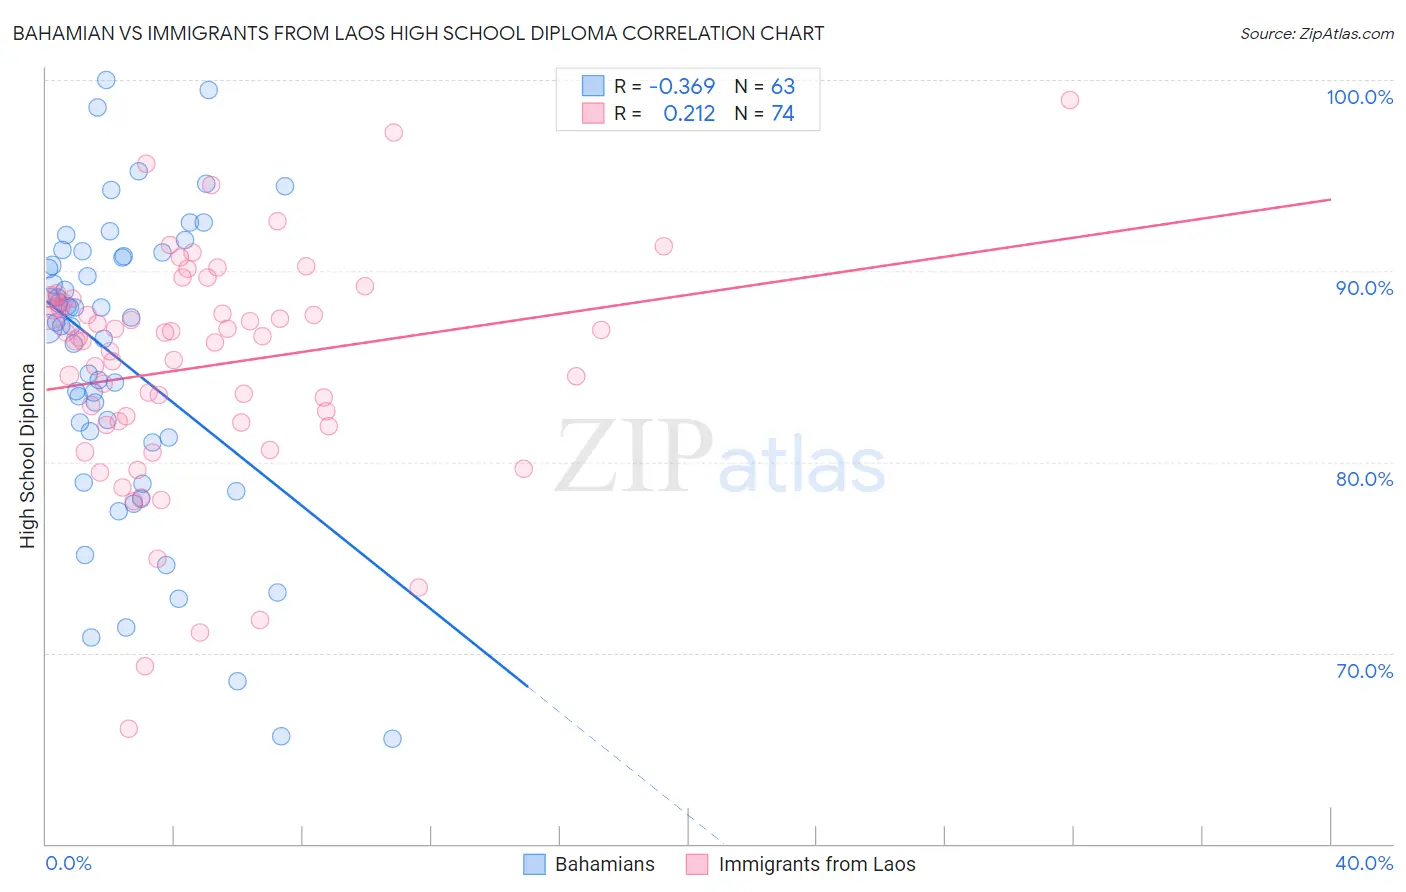
Bahamian vs Immigrants from Laos High School Diploma Correlation Chart
The statistical analysis conducted on geographies consisting of 112,698,819 people shows a mild negative correlation between the proportion of Bahamians and percentage of population with at least high school diploma education in the United States with a correlation coefficient (R) of -0.369 and weighted average of 87.5%. Similarly, the statistical analysis conducted on geographies consisting of 201,472,886 people shows a weak positive correlation between the proportion of Immigrants from Laos and percentage of population with at least high school diploma education in the United States with a correlation coefficient (R) of 0.212 and weighted average of 86.6%, a difference of 1.1%.
High School Diploma Correlation Summary
| Measurement | Bahamian | Immigrants from Laos |
| Minimum | 65.5% | 66.0% |
| Maximum | 100.0% | 98.9% |
| Range | 34.5% | 32.9% |
| Mean | 85.2% | 85.0% |
| Median | 87.1% | 86.4% |
| Interquartile 25% (IQ1) | 81.0% | 82.0% |
| Interquartile 75% (IQ3) | 90.8% | 88.4% |
| Interquartile Range (IQR) | 9.8% | 6.3% |
| Standard Deviation (Sample) | 7.9% | 6.0% |
| Standard Deviation (Population) | 7.9% | 6.0% |
Similar Demographics by High School Diploma
Demographics Similar to Bahamians by High School Diploma
In terms of high school diploma, the demographic groups most similar to Bahamians are African (87.5%, a difference of 0.0%), Immigrants from Senegal (87.6%, a difference of 0.10%), Immigrants from Ghana (87.4%, a difference of 0.10%), Immigrants from Western Africa (87.4%, a difference of 0.11%), and Immigrants from Colombia (87.6%, a difference of 0.16%).
| Demographics | Rating | Rank | High School Diploma |
| Immigrants | Nigeria | 1.5 /100 | #250 | Tragic 87.7% |
| Ghanaians | 1.4 /100 | #251 | Tragic 87.7% |
| Immigrants | South America | 1.2 /100 | #252 | Tragic 87.6% |
| Immigrants | Uruguay | 1.0 /100 | #253 | Tragic 87.6% |
| Immigrants | Colombia | 1.0 /100 | #254 | Tragic 87.6% |
| Immigrants | Senegal | 0.9 /100 | #255 | Tragic 87.6% |
| Africans | 0.7 /100 | #256 | Tragic 87.5% |
| Bahamians | 0.7 /100 | #257 | Tragic 87.5% |
| Immigrants | Ghana | 0.5 /100 | #258 | Tragic 87.4% |
| Immigrants | Western Africa | 0.5 /100 | #259 | Tragic 87.4% |
| Cajuns | 0.4 /100 | #260 | Tragic 87.3% |
| Seminole | 0.4 /100 | #261 | Tragic 87.3% |
| Immigrants | Peru | 0.4 /100 | #262 | Tragic 87.3% |
| Immigrants | South Eastern Asia | 0.3 /100 | #263 | Tragic 87.2% |
| Jamaicans | 0.3 /100 | #264 | Tragic 87.2% |
Demographics Similar to Immigrants from Laos by High School Diploma
In terms of high school diploma, the demographic groups most similar to Immigrants from Laos are Pueblo (86.5%, a difference of 0.020%), Hopi (86.6%, a difference of 0.050%), Indonesian (86.5%, a difference of 0.070%), Dutch West Indian (86.5%, a difference of 0.11%), and Barbadian (86.7%, a difference of 0.15%).
| Demographics | Rating | Rank | High School Diploma |
| Trinidadians and Tobagonians | 0.1 /100 | #272 | Tragic 86.9% |
| Immigrants | Jamaica | 0.1 /100 | #273 | Tragic 86.9% |
| Bangladeshis | 0.1 /100 | #274 | Tragic 86.9% |
| Immigrants | Trinidad and Tobago | 0.1 /100 | #275 | Tragic 86.8% |
| Immigrants | Burma/Myanmar | 0.1 /100 | #276 | Tragic 86.7% |
| Barbadians | 0.1 /100 | #277 | Tragic 86.7% |
| Hopi | 0.1 /100 | #278 | Tragic 86.6% |
| Immigrants | Laos | 0.0 /100 | #279 | Tragic 86.6% |
| Pueblo | 0.0 /100 | #280 | Tragic 86.5% |
| Indonesians | 0.0 /100 | #281 | Tragic 86.5% |
| Dutch West Indians | 0.0 /100 | #282 | Tragic 86.5% |
| Immigrants | Barbados | 0.0 /100 | #283 | Tragic 86.4% |
| Paiute | 0.0 /100 | #284 | Tragic 86.4% |
| Immigrants | West Indies | 0.0 /100 | #285 | Tragic 86.2% |
| Immigrants | St. Vincent and the Grenadines | 0.0 /100 | #286 | Tragic 86.2% |