German vs Immigrants from Hong Kong Associate's Degree
COMPARE
German
Immigrants from Hong Kong
Associate's Degree
Associate's Degree Comparison
Germans
Immigrants from Hong Kong
45.5%
ASSOCIATE'S DEGREE
26.5/ 100
METRIC RATING
195th/ 347
METRIC RANK
55.4%
ASSOCIATE'S DEGREE
100.0/ 100
METRIC RATING
14th/ 347
METRIC RANK
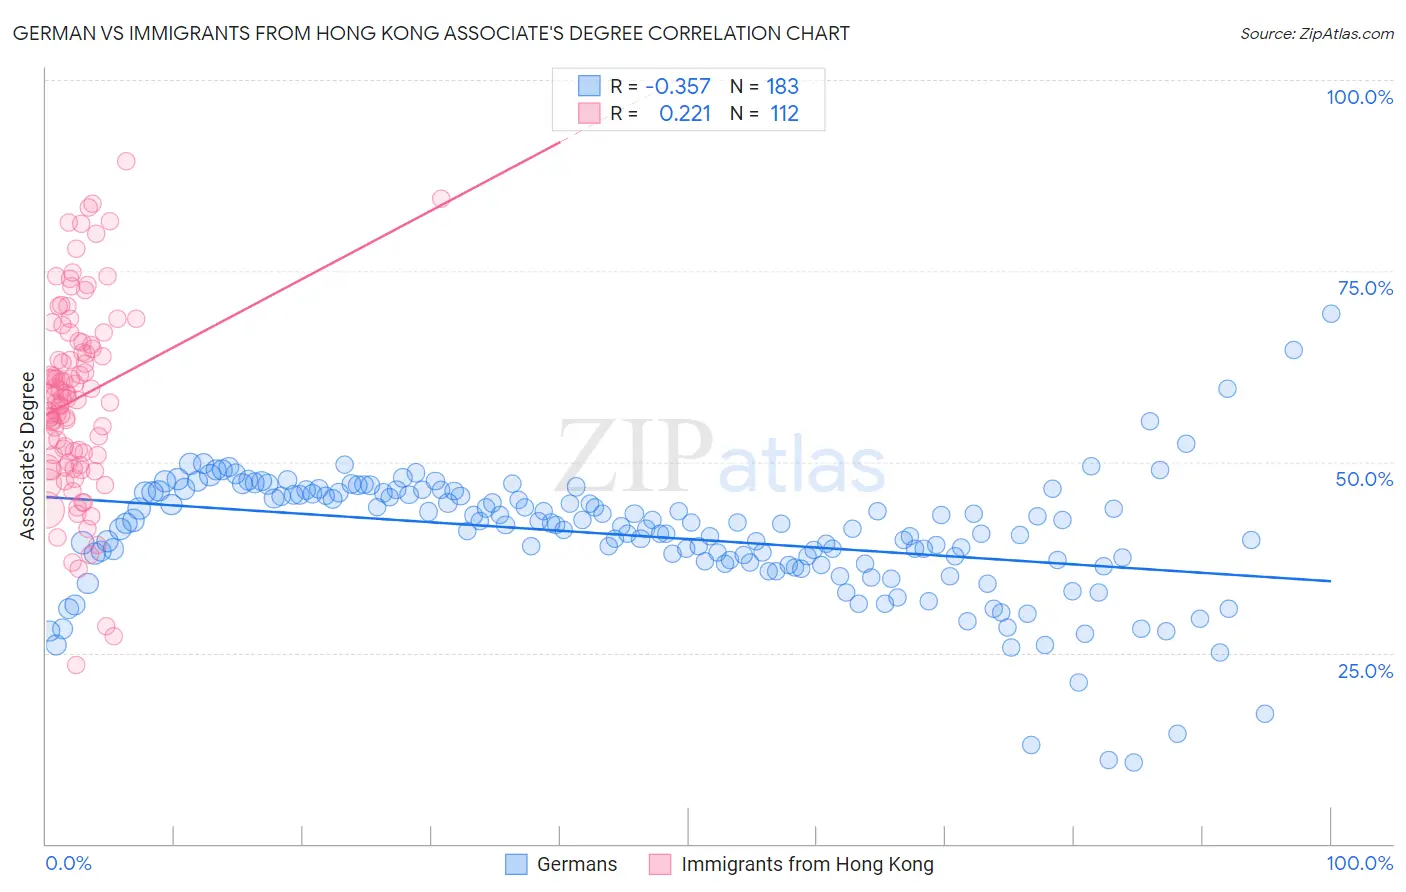
German vs Immigrants from Hong Kong Associate's Degree Correlation Chart
The statistical analysis conducted on geographies consisting of 581,143,634 people shows a mild negative correlation between the proportion of Germans and percentage of population with at least associate's degree education in the United States with a correlation coefficient (R) of -0.357 and weighted average of 45.5%. Similarly, the statistical analysis conducted on geographies consisting of 253,990,250 people shows a weak positive correlation between the proportion of Immigrants from Hong Kong and percentage of population with at least associate's degree education in the United States with a correlation coefficient (R) of 0.221 and weighted average of 55.4%, a difference of 21.8%.
Associate's Degree Correlation Summary
| Measurement | German | Immigrants from Hong Kong |
| Minimum | 10.6% | 23.3% |
| Maximum | 69.4% | 89.4% |
| Range | 58.8% | 66.0% |
| Mean | 40.3% | 58.3% |
| Median | 41.8% | 58.4% |
| Interquartile 25% (IQ1) | 36.7% | 50.4% |
| Interquartile 75% (IQ3) | 45.9% | 65.4% |
| Interquartile Range (IQR) | 9.2% | 15.1% |
| Standard Deviation (Sample) | 8.3% | 12.4% |
| Standard Deviation (Population) | 8.3% | 12.4% |
Similar Demographics by Associate's Degree
Demographics Similar to Germans by Associate's Degree
In terms of associate's degree, the demographic groups most similar to Germans are French (45.4%, a difference of 0.090%), Immigrants from Peru (45.5%, a difference of 0.10%), Immigrants from Cameroon (45.7%, a difference of 0.42%), Scotch-Irish (45.3%, a difference of 0.44%), and Immigrants from Bangladesh (45.2%, a difference of 0.54%).
| Demographics | Rating | Rank | Associate's Degree |
| Ghanaians | 35.5 /100 | #188 | Fair 45.8% |
| Immigrants | Oceania | 34.7 /100 | #189 | Fair 45.8% |
| Vietnamese | 34.0 /100 | #190 | Fair 45.8% |
| Koreans | 33.8 /100 | #191 | Fair 45.8% |
| Celtics | 33.3 /100 | #192 | Fair 45.8% |
| Immigrants | Cameroon | 31.0 /100 | #193 | Fair 45.7% |
| Immigrants | Peru | 27.6 /100 | #194 | Fair 45.5% |
| Germans | 26.5 /100 | #195 | Fair 45.5% |
| French | 25.6 /100 | #196 | Fair 45.4% |
| Scotch-Irish | 22.3 /100 | #197 | Fair 45.3% |
| Immigrants | Bangladesh | 21.3 /100 | #198 | Fair 45.2% |
| Immigrants | Senegal | 21.2 /100 | #199 | Fair 45.2% |
| Senegalese | 21.1 /100 | #200 | Fair 45.2% |
| Immigrants | Vietnam | 20.8 /100 | #201 | Fair 45.2% |
| Spaniards | 20.4 /100 | #202 | Fair 45.2% |
Demographics Similar to Immigrants from Hong Kong by Associate's Degree
In terms of associate's degree, the demographic groups most similar to Immigrants from Hong Kong are Immigrants from Eastern Asia (55.4%, a difference of 0.030%), Immigrants from China (55.5%, a difference of 0.14%), Soviet Union (55.1%, a difference of 0.50%), Immigrants from South Central Asia (55.7%, a difference of 0.63%), and Eastern European (55.0%, a difference of 0.64%).
| Demographics | Rating | Rank | Associate's Degree |
| Immigrants | Iran | 100.0 /100 | #7 | Exceptional 57.7% |
| Thais | 100.0 /100 | #8 | Exceptional 57.4% |
| Immigrants | Israel | 100.0 /100 | #9 | Exceptional 56.8% |
| Cypriots | 100.0 /100 | #10 | Exceptional 56.4% |
| Immigrants | Australia | 100.0 /100 | #11 | Exceptional 55.8% |
| Immigrants | South Central Asia | 100.0 /100 | #12 | Exceptional 55.7% |
| Immigrants | China | 100.0 /100 | #13 | Exceptional 55.5% |
| Immigrants | Hong Kong | 100.0 /100 | #14 | Exceptional 55.4% |
| Immigrants | Eastern Asia | 100.0 /100 | #15 | Exceptional 55.4% |
| Soviet Union | 100.0 /100 | #16 | Exceptional 55.1% |
| Eastern Europeans | 100.0 /100 | #17 | Exceptional 55.0% |
| Indians (Asian) | 100.0 /100 | #18 | Exceptional 54.8% |
| Immigrants | Ireland | 100.0 /100 | #19 | Exceptional 54.7% |
| Cambodians | 100.0 /100 | #20 | Exceptional 54.6% |
| Immigrants | Sweden | 100.0 /100 | #21 | Exceptional 54.6% |