Houma vs Uruguayan Associate's Degree
COMPARE
Houma
Uruguayan
Associate's Degree
Associate's Degree Comparison
Houma
Uruguayans
28.2%
ASSOCIATE'S DEGREE
0.0/ 100
METRIC RATING
346th/ 347
METRIC RANK
46.5%
ASSOCIATE'S DEGREE
55.4/ 100
METRIC RATING
169th/ 347
METRIC RANK
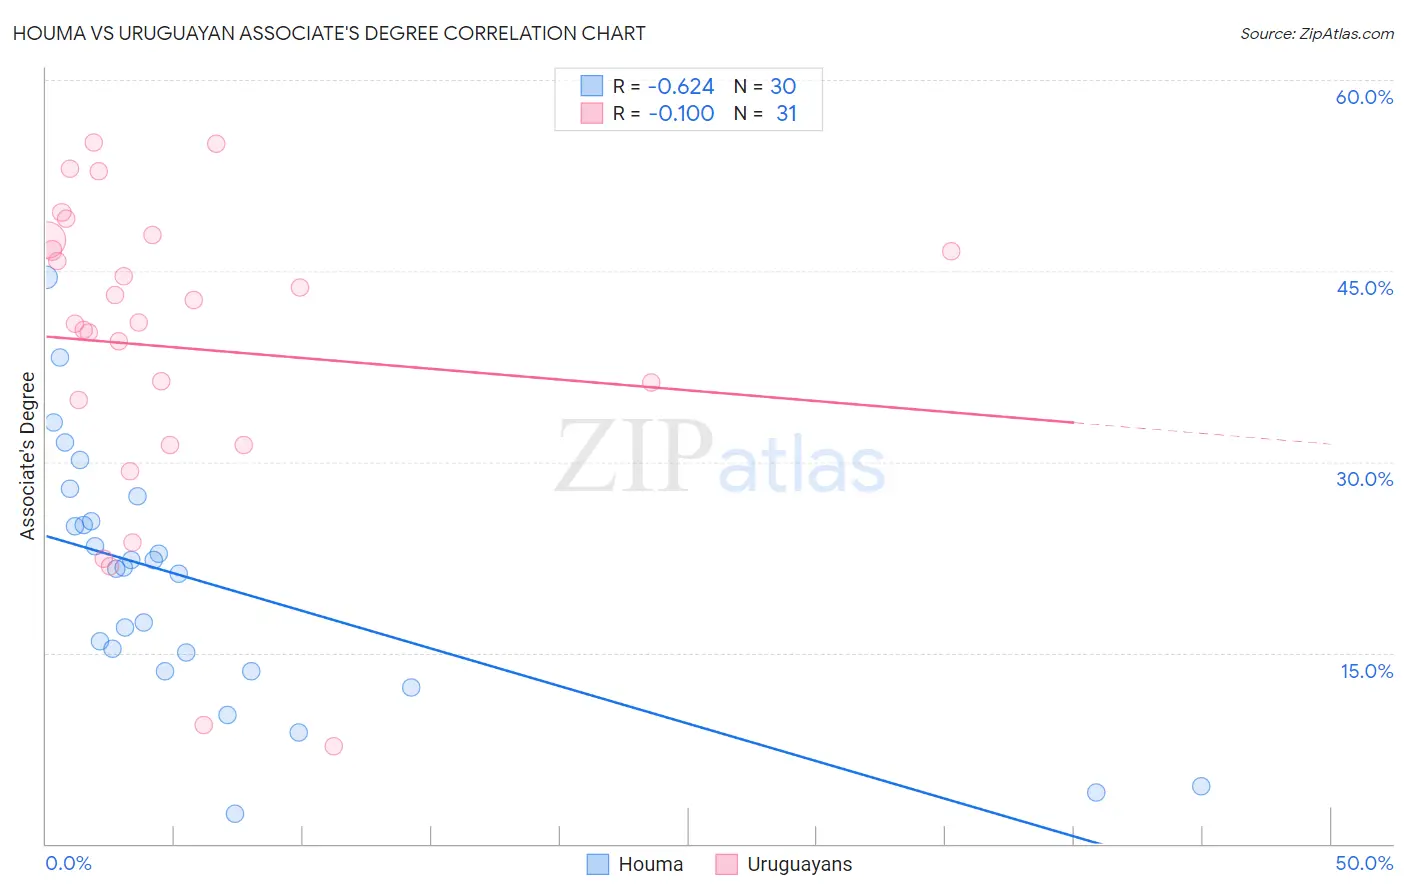
Houma vs Uruguayan Associate's Degree Correlation Chart
The statistical analysis conducted on geographies consisting of 36,792,820 people shows a significant negative correlation between the proportion of Houma and percentage of population with at least associate's degree education in the United States with a correlation coefficient (R) of -0.624 and weighted average of 28.2%. Similarly, the statistical analysis conducted on geographies consisting of 144,782,470 people shows a poor negative correlation between the proportion of Uruguayans and percentage of population with at least associate's degree education in the United States with a correlation coefficient (R) of -0.100 and weighted average of 46.5%, a difference of 65.0%.
Associate's Degree Correlation Summary
| Measurement | Houma | Uruguayan |
| Minimum | 2.4% | 7.6% |
| Maximum | 44.5% | 55.1% |
| Range | 42.2% | 47.5% |
| Mean | 20.4% | 39.0% |
| Median | 21.7% | 40.9% |
| Interquartile 25% (IQ1) | 13.5% | 31.4% |
| Interquartile 75% (IQ3) | 25.3% | 47.4% |
| Interquartile Range (IQR) | 11.8% | 16.1% |
| Standard Deviation (Sample) | 9.9% | 12.2% |
| Standard Deviation (Population) | 9.7% | 12.0% |
Similar Demographics by Associate's Degree
Demographics Similar to Houma by Associate's Degree
In terms of associate's degree, the demographic groups most similar to Houma are Pima (30.2%, a difference of 7.2%), Yuman (31.3%, a difference of 10.8%), Tohono O'odham (31.8%, a difference of 12.7%), Yup'ik (25.0%, a difference of 13.0%), and Yakama (32.3%, a difference of 14.6%).
| Demographics | Rating | Rank | Associate's Degree |
| Mexicans | 0.0 /100 | #333 | Tragic 35.0% |
| Natives/Alaskans | 0.0 /100 | #334 | Tragic 34.9% |
| Spanish American Indians | 0.0 /100 | #335 | Tragic 34.9% |
| Hopi | 0.0 /100 | #336 | Tragic 34.6% |
| Lumbee | 0.0 /100 | #337 | Tragic 34.1% |
| Pueblo | 0.0 /100 | #338 | Tragic 34.0% |
| Immigrants | Mexico | 0.0 /100 | #339 | Tragic 33.7% |
| Navajo | 0.0 /100 | #340 | Tragic 32.6% |
| Inupiat | 0.0 /100 | #341 | Tragic 32.6% |
| Yakama | 0.0 /100 | #342 | Tragic 32.3% |
| Tohono O'odham | 0.0 /100 | #343 | Tragic 31.8% |
| Yuman | 0.0 /100 | #344 | Tragic 31.3% |
| Pima | 0.0 /100 | #345 | Tragic 30.2% |
| Houma | 0.0 /100 | #346 | Tragic 28.2% |
| Yup'ik | 0.0 /100 | #347 | Tragic 25.0% |
Demographics Similar to Uruguayans by Associate's Degree
In terms of associate's degree, the demographic groups most similar to Uruguayans are Immigrants from Somalia (46.5%, a difference of 0.010%), Irish (46.5%, a difference of 0.13%), Basque (46.5%, a difference of 0.19%), Immigrants from Sierra Leone (46.7%, a difference of 0.29%), and Hungarian (46.7%, a difference of 0.30%).
| Demographics | Rating | Rank | Associate's Degree |
| Immigrants | Africa | 63.2 /100 | #162 | Good 46.8% |
| Somalis | 62.5 /100 | #163 | Good 46.8% |
| Colombians | 62.4 /100 | #164 | Good 46.8% |
| Immigrants | South America | 59.9 /100 | #165 | Average 46.7% |
| Hungarians | 59.3 /100 | #166 | Average 46.7% |
| Immigrants | Sierra Leone | 59.2 /100 | #167 | Average 46.7% |
| Immigrants | Somalia | 55.5 /100 | #168 | Average 46.5% |
| Uruguayans | 55.4 /100 | #169 | Average 46.5% |
| Irish | 53.6 /100 | #170 | Average 46.5% |
| Basques | 52.8 /100 | #171 | Average 46.5% |
| Peruvians | 50.5 /100 | #172 | Average 46.4% |
| Immigrants | Iraq | 50.3 /100 | #173 | Average 46.4% |
| English | 50.0 /100 | #174 | Average 46.4% |
| Belgians | 48.9 /100 | #175 | Average 46.3% |
| Finns | 48.5 /100 | #176 | Average 46.3% |