Houma vs Guamanian/Chamorro Associate's Degree
COMPARE
Houma
Guamanian/Chamorro
Associate's Degree
Associate's Degree Comparison
Houma
Guamanians/Chamorros
28.2%
ASSOCIATE'S DEGREE
0.0/ 100
METRIC RATING
346th/ 347
METRIC RANK
43.8%
ASSOCIATE'S DEGREE
4.8/ 100
METRIC RATING
225th/ 347
METRIC RANK
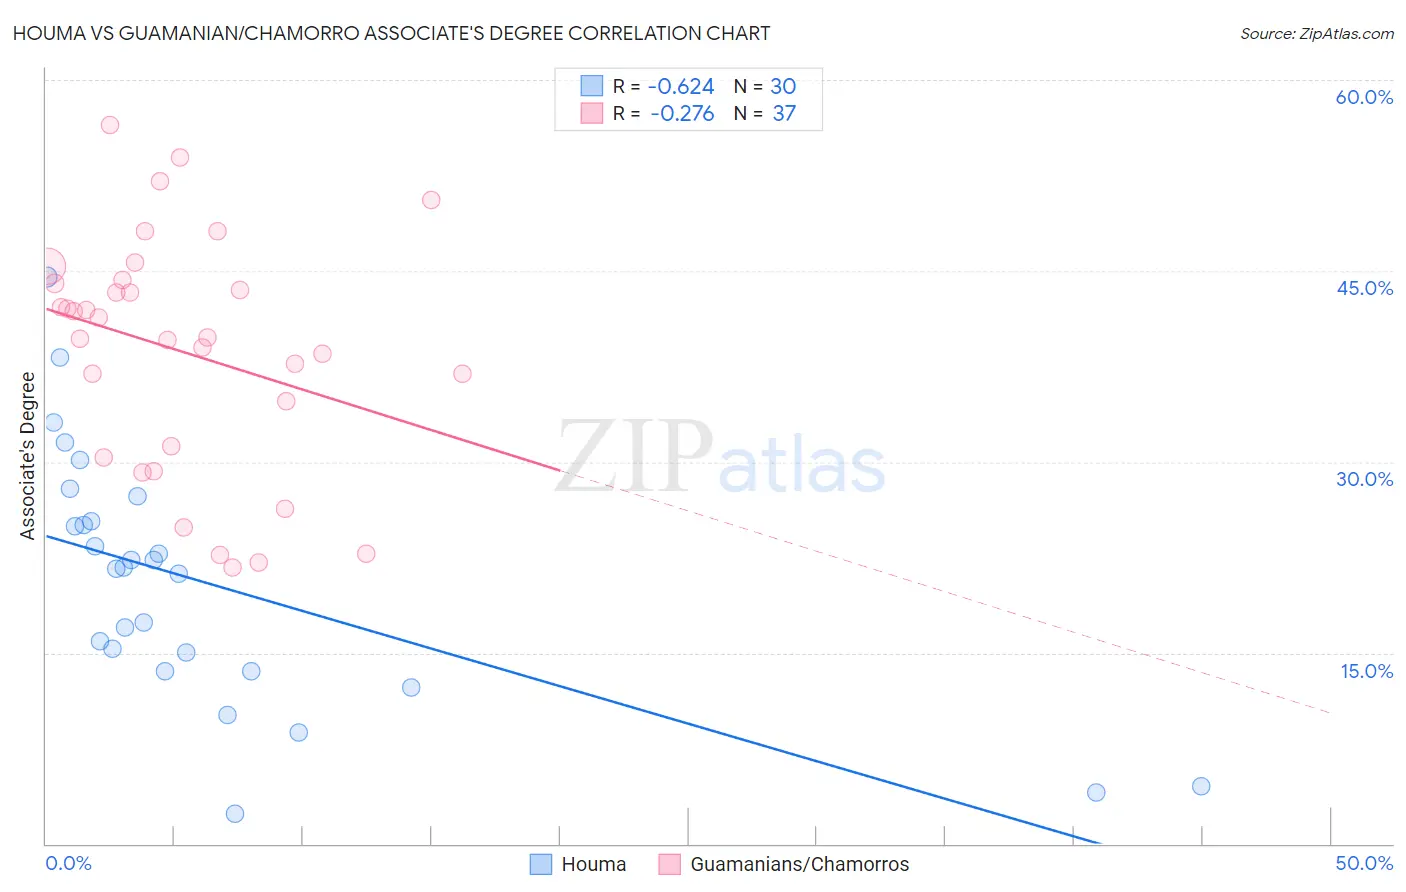
Houma vs Guamanian/Chamorro Associate's Degree Correlation Chart
The statistical analysis conducted on geographies consisting of 36,792,820 people shows a significant negative correlation between the proportion of Houma and percentage of population with at least associate's degree education in the United States with a correlation coefficient (R) of -0.624 and weighted average of 28.2%. Similarly, the statistical analysis conducted on geographies consisting of 221,965,027 people shows a weak negative correlation between the proportion of Guamanians/Chamorros and percentage of population with at least associate's degree education in the United States with a correlation coefficient (R) of -0.276 and weighted average of 43.8%, a difference of 55.2%.
Associate's Degree Correlation Summary
| Measurement | Houma | Guamanian/Chamorro |
| Minimum | 2.4% | 21.7% |
| Maximum | 44.5% | 56.4% |
| Range | 42.2% | 34.7% |
| Mean | 20.4% | 38.7% |
| Median | 21.7% | 39.8% |
| Interquartile 25% (IQ1) | 13.5% | 30.8% |
| Interquartile 75% (IQ3) | 25.3% | 44.1% |
| Interquartile Range (IQR) | 11.8% | 13.4% |
| Standard Deviation (Sample) | 9.9% | 9.2% |
| Standard Deviation (Population) | 9.7% | 9.1% |
Similar Demographics by Associate's Degree
Demographics Similar to Houma by Associate's Degree
In terms of associate's degree, the demographic groups most similar to Houma are Pima (30.2%, a difference of 7.2%), Yuman (31.3%, a difference of 10.8%), Tohono O'odham (31.8%, a difference of 12.7%), Yup'ik (25.0%, a difference of 13.0%), and Yakama (32.3%, a difference of 14.6%).
| Demographics | Rating | Rank | Associate's Degree |
| Mexicans | 0.0 /100 | #333 | Tragic 35.0% |
| Natives/Alaskans | 0.0 /100 | #334 | Tragic 34.9% |
| Spanish American Indians | 0.0 /100 | #335 | Tragic 34.9% |
| Hopi | 0.0 /100 | #336 | Tragic 34.6% |
| Lumbee | 0.0 /100 | #337 | Tragic 34.1% |
| Pueblo | 0.0 /100 | #338 | Tragic 34.0% |
| Immigrants | Mexico | 0.0 /100 | #339 | Tragic 33.7% |
| Navajo | 0.0 /100 | #340 | Tragic 32.6% |
| Inupiat | 0.0 /100 | #341 | Tragic 32.6% |
| Yakama | 0.0 /100 | #342 | Tragic 32.3% |
| Tohono O'odham | 0.0 /100 | #343 | Tragic 31.8% |
| Yuman | 0.0 /100 | #344 | Tragic 31.3% |
| Pima | 0.0 /100 | #345 | Tragic 30.2% |
| Houma | 0.0 /100 | #346 | Tragic 28.2% |
| Yup'ik | 0.0 /100 | #347 | Tragic 25.0% |
Demographics Similar to Guamanians/Chamorros by Associate's Degree
In terms of associate's degree, the demographic groups most similar to Guamanians/Chamorros are West Indian (43.8%, a difference of 0.15%), Immigrants from Burma/Myanmar (43.7%, a difference of 0.22%), Subsaharan African (43.9%, a difference of 0.29%), Barbadian (43.9%, a difference of 0.39%), and Trinidadian and Tobagonian (43.6%, a difference of 0.39%).
| Demographics | Rating | Rank | Associate's Degree |
| Spanish | 9.4 /100 | #218 | Tragic 44.4% |
| Whites/Caucasians | 7.5 /100 | #219 | Tragic 44.2% |
| Portuguese | 7.2 /100 | #220 | Tragic 44.1% |
| Immigrants | Western Africa | 6.6 /100 | #221 | Tragic 44.1% |
| Barbadians | 5.8 /100 | #222 | Tragic 43.9% |
| Sub-Saharan Africans | 5.5 /100 | #223 | Tragic 43.9% |
| West Indians | 5.2 /100 | #224 | Tragic 43.8% |
| Guamanians/Chamorros | 4.8 /100 | #225 | Tragic 43.8% |
| Immigrants | Burma/Myanmar | 4.3 /100 | #226 | Tragic 43.7% |
| Trinidadians and Tobagonians | 4.0 /100 | #227 | Tragic 43.6% |
| Hmong | 3.2 /100 | #228 | Tragic 43.4% |
| Immigrants | Trinidad and Tobago | 3.0 /100 | #229 | Tragic 43.3% |
| Immigrants | Barbados | 2.9 /100 | #230 | Tragic 43.3% |
| Liberians | 2.9 /100 | #231 | Tragic 43.3% |
| Native Hawaiians | 2.3 /100 | #232 | Tragic 43.1% |