Hmong vs Cajun GED/Equivalency
COMPARE
Hmong
Cajun
GED/Equivalency
GED/Equivalency Comparison
Hmong
Cajuns
84.9%
GED/EQUIVALENCY
13.1/ 100
METRIC RATING
207th/ 347
METRIC RANK
82.4%
GED/EQUIVALENCY
0.0/ 100
METRIC RATING
285th/ 347
METRIC RANK
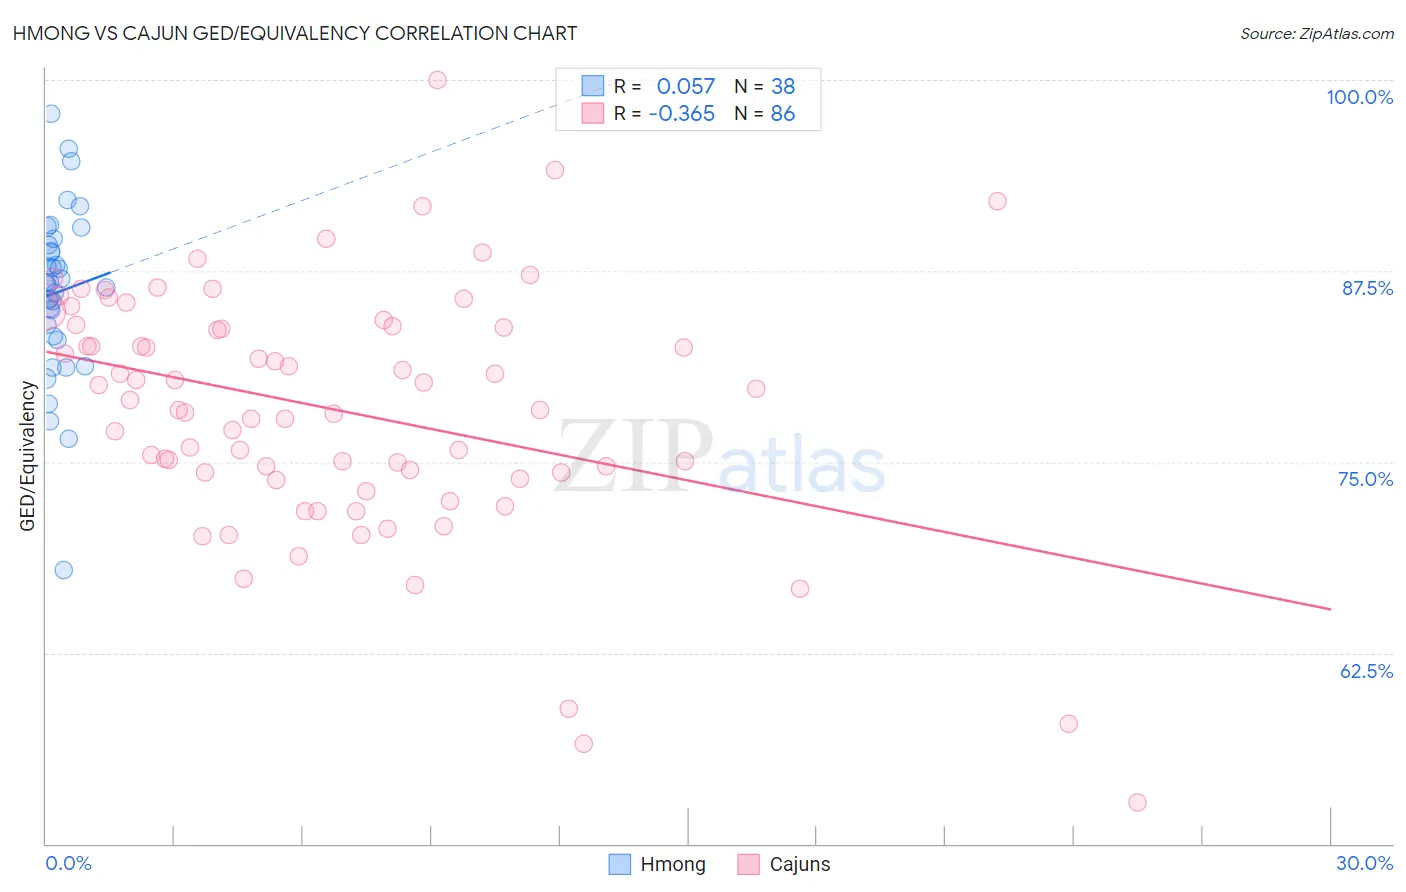
Hmong vs Cajun GED/Equivalency Correlation Chart
The statistical analysis conducted on geographies consisting of 24,672,093 people shows a slight positive correlation between the proportion of Hmong and percentage of population with at least ged/equivalency education in the United States with a correlation coefficient (R) of 0.057 and weighted average of 84.9%. Similarly, the statistical analysis conducted on geographies consisting of 149,713,149 people shows a mild negative correlation between the proportion of Cajuns and percentage of population with at least ged/equivalency education in the United States with a correlation coefficient (R) of -0.365 and weighted average of 82.4%, a difference of 3.1%.
GED/Equivalency Correlation Summary
| Measurement | Hmong | Cajun |
| Minimum | 67.9% | 52.7% |
| Maximum | 97.8% | 100.0% |
| Range | 29.9% | 47.3% |
| Mean | 86.1% | 78.4% |
| Median | 86.7% | 78.7% |
| Interquartile 25% (IQ1) | 83.2% | 74.3% |
| Interquartile 75% (IQ3) | 89.2% | 83.9% |
| Interquartile Range (IQR) | 6.0% | 9.6% |
| Standard Deviation (Sample) | 5.6% | 8.1% |
| Standard Deviation (Population) | 5.5% | 8.1% |
Similar Demographics by GED/Equivalency
Demographics Similar to Hmong by GED/Equivalency
In terms of ged/equivalency, the demographic groups most similar to Hmong are Samoan (84.9%, a difference of 0.020%), Marshallese (84.9%, a difference of 0.030%), Colombian (84.9%, a difference of 0.040%), Immigrants from Cameroon (84.9%, a difference of 0.050%), and Liberian (85.0%, a difference of 0.060%).
| Demographics | Rating | Rank | GED/Equivalency |
| Uruguayans | 16.0 /100 | #200 | Poor 85.0% |
| Portuguese | 15.9 /100 | #201 | Poor 85.0% |
| Cree | 15.9 /100 | #202 | Poor 85.0% |
| Panamanians | 15.3 /100 | #203 | Poor 85.0% |
| Hawaiians | 15.2 /100 | #204 | Poor 85.0% |
| Liberians | 14.6 /100 | #205 | Poor 85.0% |
| Samoans | 13.7 /100 | #206 | Poor 84.9% |
| Hmong | 13.1 /100 | #207 | Poor 84.9% |
| Marshallese | 12.5 /100 | #208 | Poor 84.9% |
| Colombians | 12.3 /100 | #209 | Poor 84.9% |
| Immigrants | Cameroon | 12.1 /100 | #210 | Poor 84.9% |
| South Americans | 10.9 /100 | #211 | Poor 84.8% |
| Immigrants | Somalia | 10.6 /100 | #212 | Poor 84.8% |
| Immigrants | Philippines | 10.0 /100 | #213 | Poor 84.8% |
| Osage | 9.5 /100 | #214 | Tragic 84.8% |
Demographics Similar to Cajuns by GED/Equivalency
In terms of ged/equivalency, the demographic groups most similar to Cajuns are Immigrants from West Indies (82.4%, a difference of 0.020%), Immigrants from Barbados (82.4%, a difference of 0.030%), Japanese (82.4%, a difference of 0.040%), Pueblo (82.3%, a difference of 0.14%), and Indonesian (82.5%, a difference of 0.15%).
| Demographics | Rating | Rank | GED/Equivalency |
| Immigrants | Laos | 0.1 /100 | #278 | Tragic 82.7% |
| Immigrants | Fiji | 0.1 /100 | #279 | Tragic 82.7% |
| Cheyenne | 0.1 /100 | #280 | Tragic 82.7% |
| Sioux | 0.1 /100 | #281 | Tragic 82.6% |
| Immigrants | Immigrants | 0.1 /100 | #282 | Tragic 82.6% |
| Indonesians | 0.1 /100 | #283 | Tragic 82.5% |
| Immigrants | Barbados | 0.1 /100 | #284 | Tragic 82.4% |
| Cajuns | 0.0 /100 | #285 | Tragic 82.4% |
| Immigrants | West Indies | 0.0 /100 | #286 | Tragic 82.4% |
| Japanese | 0.0 /100 | #287 | Tragic 82.4% |
| Pueblo | 0.0 /100 | #288 | Tragic 82.3% |
| Immigrants | Cambodia | 0.0 /100 | #289 | Tragic 82.2% |
| Haitians | 0.0 /100 | #290 | Tragic 82.1% |
| Cubans | 0.0 /100 | #291 | Tragic 82.0% |
| Paiute | 0.0 /100 | #292 | Tragic 82.0% |