Hawaiian vs Nonimmigrants 9th Grade
COMPARE
Hawaiian
Nonimmigrants
9th Grade
9th Grade Comparison
Hawaiians
Nonimmigrants
94.7%
9TH GRADE
22.7/ 100
METRIC RATING
198th/ 347
METRIC RANK
95.3%
9TH GRADE
92.0/ 100
METRIC RATING
132nd/ 347
METRIC RANK
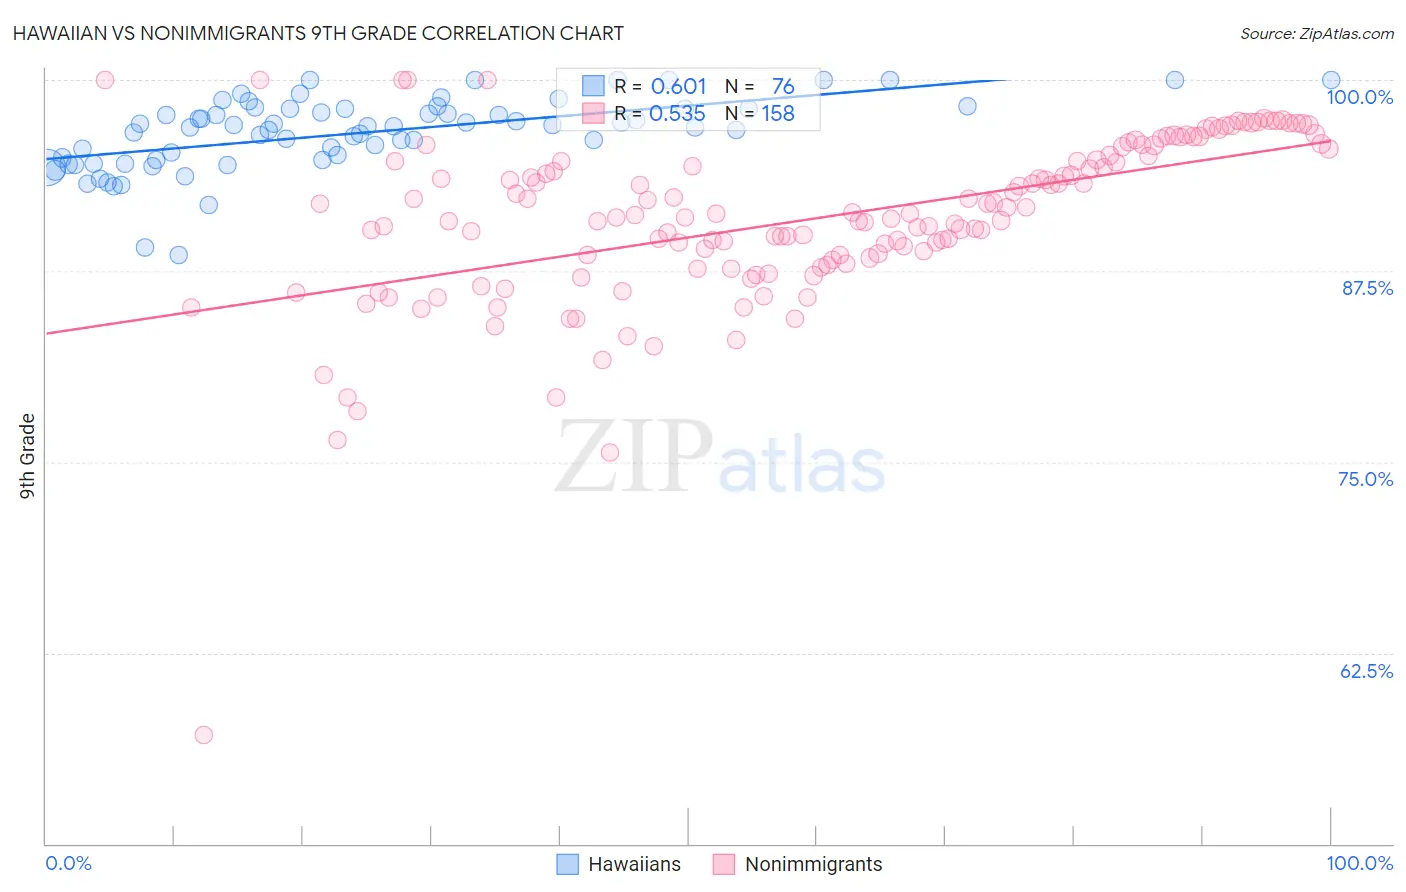
Hawaiian vs Nonimmigrants 9th Grade Correlation Chart
The statistical analysis conducted on geographies consisting of 327,620,881 people shows a significant positive correlation between the proportion of Hawaiians and percentage of population with at least 9th grade education in the United States with a correlation coefficient (R) of 0.601 and weighted average of 94.7%. Similarly, the statistical analysis conducted on geographies consisting of 585,372,544 people shows a substantial positive correlation between the proportion of Nonimmigrants and percentage of population with at least 9th grade education in the United States with a correlation coefficient (R) of 0.535 and weighted average of 95.3%, a difference of 0.67%.
9th Grade Correlation Summary
| Measurement | Hawaiian | Nonimmigrants |
| Minimum | 88.5% | 57.2% |
| Maximum | 100.0% | 100.0% |
| Range | 11.5% | 42.8% |
| Mean | 96.5% | 91.0% |
| Median | 97.0% | 91.2% |
| Interquartile 25% (IQ1) | 94.8% | 88.2% |
| Interquartile 75% (IQ3) | 98.1% | 95.0% |
| Interquartile Range (IQR) | 3.3% | 6.8% |
| Standard Deviation (Sample) | 2.4% | 5.6% |
| Standard Deviation (Population) | 2.4% | 5.6% |
Similar Demographics by 9th Grade
Demographics Similar to Hawaiians by 9th Grade
In terms of 9th grade, the demographic groups most similar to Hawaiians are Immigrants from Micronesia (94.7%, a difference of 0.020%), Laotian (94.6%, a difference of 0.020%), Immigrants from Zaire (94.6%, a difference of 0.020%), Black/African American (94.6%, a difference of 0.020%), and Immigrants from Eastern Asia (94.6%, a difference of 0.030%).
| Demographics | Rating | Rank | 9th Grade |
| Assyrians/Chaldeans/Syriacs | 32.0 /100 | #191 | Fair 94.7% |
| Immigrants | Northern Africa | 30.7 /100 | #192 | Fair 94.7% |
| Paraguayans | 30.1 /100 | #193 | Fair 94.7% |
| Panamanians | 29.0 /100 | #194 | Fair 94.7% |
| Marshallese | 27.9 /100 | #195 | Fair 94.7% |
| Immigrants | Lebanon | 27.2 /100 | #196 | Fair 94.7% |
| Immigrants | Micronesia | 24.7 /100 | #197 | Fair 94.7% |
| Hawaiians | 22.7 /100 | #198 | Fair 94.7% |
| Laotians | 21.0 /100 | #199 | Fair 94.6% |
| Immigrants | Zaire | 20.6 /100 | #200 | Fair 94.6% |
| Blacks/African Americans | 20.5 /100 | #201 | Fair 94.6% |
| Immigrants | Eastern Asia | 19.8 /100 | #202 | Poor 94.6% |
| Immigrants | Bahamas | 19.8 /100 | #203 | Poor 94.6% |
| Moroccans | 19.6 /100 | #204 | Poor 94.6% |
| Immigrants | Sudan | 17.6 /100 | #205 | Poor 94.6% |
Demographics Similar to Nonimmigrants by 9th Grade
In terms of 9th grade, the demographic groups most similar to Nonimmigrants are Immigrants from North Macedonia (95.3%, a difference of 0.010%), Israeli (95.3%, a difference of 0.030%), Jordanian (95.3%, a difference of 0.040%), Immigrants from Israel (95.3%, a difference of 0.050%), and Immigrants from Hungary (95.4%, a difference of 0.060%).
| Demographics | Rating | Rank | 9th Grade |
| Immigrants | South Central Asia | 95.1 /100 | #125 | Exceptional 95.4% |
| Immigrants | Serbia | 94.4 /100 | #126 | Exceptional 95.4% |
| Palestinians | 94.3 /100 | #127 | Exceptional 95.4% |
| Immigrants | Hungary | 94.2 /100 | #128 | Exceptional 95.4% |
| Basques | 94.1 /100 | #129 | Exceptional 95.4% |
| Jordanians | 93.5 /100 | #130 | Exceptional 95.3% |
| Immigrants | North Macedonia | 92.3 /100 | #131 | Exceptional 95.3% |
| Immigrants | Nonimmigrants | 92.0 /100 | #132 | Exceptional 95.3% |
| Israelis | 90.4 /100 | #133 | Exceptional 95.3% |
| Immigrants | Israel | 89.6 /100 | #134 | Excellent 95.3% |
| Immigrants | Belarus | 88.9 /100 | #135 | Excellent 95.2% |
| Immigrants | Iran | 88.3 /100 | #136 | Excellent 95.2% |
| Hmong | 87.7 /100 | #137 | Excellent 95.2% |
| Immigrants | Russia | 86.6 /100 | #138 | Excellent 95.2% |
| Immigrants | Eastern Europe | 85.8 /100 | #139 | Excellent 95.2% |