Hawaiian vs Immigrants from Trinidad and Tobago 9th Grade
COMPARE
Hawaiian
Immigrants from Trinidad and Tobago
9th Grade
9th Grade Comparison
Hawaiians
Immigrants from Trinidad and Tobago
94.7%
9TH GRADE
22.7/ 100
METRIC RATING
198th/ 347
METRIC RANK
93.6%
9TH GRADE
0.1/ 100
METRIC RATING
281st/ 347
METRIC RANK
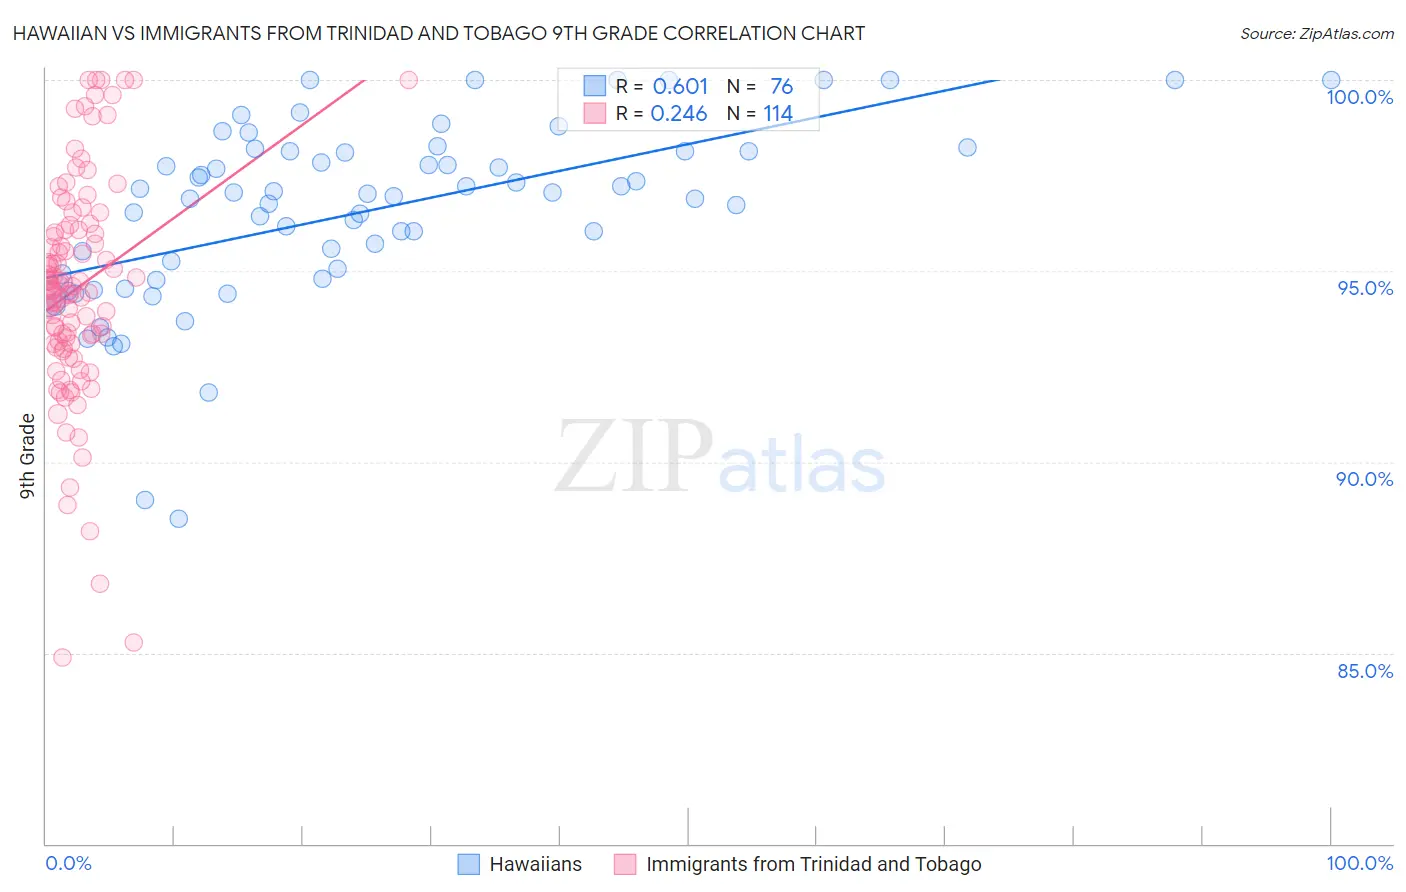
Hawaiian vs Immigrants from Trinidad and Tobago 9th Grade Correlation Chart
The statistical analysis conducted on geographies consisting of 327,620,881 people shows a significant positive correlation between the proportion of Hawaiians and percentage of population with at least 9th grade education in the United States with a correlation coefficient (R) of 0.601 and weighted average of 94.7%. Similarly, the statistical analysis conducted on geographies consisting of 223,526,834 people shows a weak positive correlation between the proportion of Immigrants from Trinidad and Tobago and percentage of population with at least 9th grade education in the United States with a correlation coefficient (R) of 0.246 and weighted average of 93.6%, a difference of 1.2%.
9th Grade Correlation Summary
| Measurement | Hawaiian | Immigrants from Trinidad and Tobago |
| Minimum | 88.5% | 84.9% |
| Maximum | 100.0% | 100.0% |
| Range | 11.5% | 15.1% |
| Mean | 96.5% | 94.5% |
| Median | 97.0% | 94.6% |
| Interquartile 25% (IQ1) | 94.8% | 93.1% |
| Interquartile 75% (IQ3) | 98.1% | 96.1% |
| Interquartile Range (IQR) | 3.3% | 3.0% |
| Standard Deviation (Sample) | 2.4% | 2.9% |
| Standard Deviation (Population) | 2.4% | 2.9% |
Similar Demographics by 9th Grade
Demographics Similar to Hawaiians by 9th Grade
In terms of 9th grade, the demographic groups most similar to Hawaiians are Immigrants from Micronesia (94.7%, a difference of 0.020%), Laotian (94.6%, a difference of 0.020%), Immigrants from Zaire (94.6%, a difference of 0.020%), Black/African American (94.6%, a difference of 0.020%), and Immigrants from Eastern Asia (94.6%, a difference of 0.030%).
| Demographics | Rating | Rank | 9th Grade |
| Assyrians/Chaldeans/Syriacs | 32.0 /100 | #191 | Fair 94.7% |
| Immigrants | Northern Africa | 30.7 /100 | #192 | Fair 94.7% |
| Paraguayans | 30.1 /100 | #193 | Fair 94.7% |
| Panamanians | 29.0 /100 | #194 | Fair 94.7% |
| Marshallese | 27.9 /100 | #195 | Fair 94.7% |
| Immigrants | Lebanon | 27.2 /100 | #196 | Fair 94.7% |
| Immigrants | Micronesia | 24.7 /100 | #197 | Fair 94.7% |
| Hawaiians | 22.7 /100 | #198 | Fair 94.7% |
| Laotians | 21.0 /100 | #199 | Fair 94.6% |
| Immigrants | Zaire | 20.6 /100 | #200 | Fair 94.6% |
| Blacks/African Americans | 20.5 /100 | #201 | Fair 94.6% |
| Immigrants | Eastern Asia | 19.8 /100 | #202 | Poor 94.6% |
| Immigrants | Bahamas | 19.8 /100 | #203 | Poor 94.6% |
| Moroccans | 19.6 /100 | #204 | Poor 94.6% |
| Immigrants | Sudan | 17.6 /100 | #205 | Poor 94.6% |
Demographics Similar to Immigrants from Trinidad and Tobago by 9th Grade
In terms of 9th grade, the demographic groups most similar to Immigrants from Trinidad and Tobago are Taiwanese (93.6%, a difference of 0.040%), Malaysian (93.5%, a difference of 0.050%), Barbadian (93.5%, a difference of 0.070%), Trinidadian and Tobagonian (93.7%, a difference of 0.12%), and Bangladeshi (93.4%, a difference of 0.14%).
| Demographics | Rating | Rank | 9th Grade |
| Peruvians | 0.2 /100 | #274 | Tragic 93.8% |
| Immigrants | Colombia | 0.2 /100 | #275 | Tragic 93.8% |
| West Indians | 0.2 /100 | #276 | Tragic 93.7% |
| Immigrants | Philippines | 0.1 /100 | #277 | Tragic 93.7% |
| Immigrants | Eritrea | 0.1 /100 | #278 | Tragic 93.7% |
| Trinidadians and Tobagonians | 0.1 /100 | #279 | Tragic 93.7% |
| Taiwanese | 0.1 /100 | #280 | Tragic 93.6% |
| Immigrants | Trinidad and Tobago | 0.1 /100 | #281 | Tragic 93.6% |
| Malaysians | 0.0 /100 | #282 | Tragic 93.5% |
| Barbadians | 0.0 /100 | #283 | Tragic 93.5% |
| Bangladeshis | 0.0 /100 | #284 | Tragic 93.4% |
| Immigrants | Peru | 0.0 /100 | #285 | Tragic 93.4% |
| Immigrants | Barbados | 0.0 /100 | #286 | Tragic 93.4% |
| Immigrants | St. Vincent and the Grenadines | 0.0 /100 | #287 | Tragic 93.4% |
| Immigrants | South Eastern Asia | 0.0 /100 | #288 | Tragic 93.3% |