Kenyan vs Nonimmigrants 9th Grade
COMPARE
Kenyan
Nonimmigrants
9th Grade
9th Grade Comparison
Kenyans
Nonimmigrants
95.1%
9TH GRADE
79.1/ 100
METRIC RATING
150th/ 347
METRIC RANK
95.3%
9TH GRADE
92.0/ 100
METRIC RATING
132nd/ 347
METRIC RANK
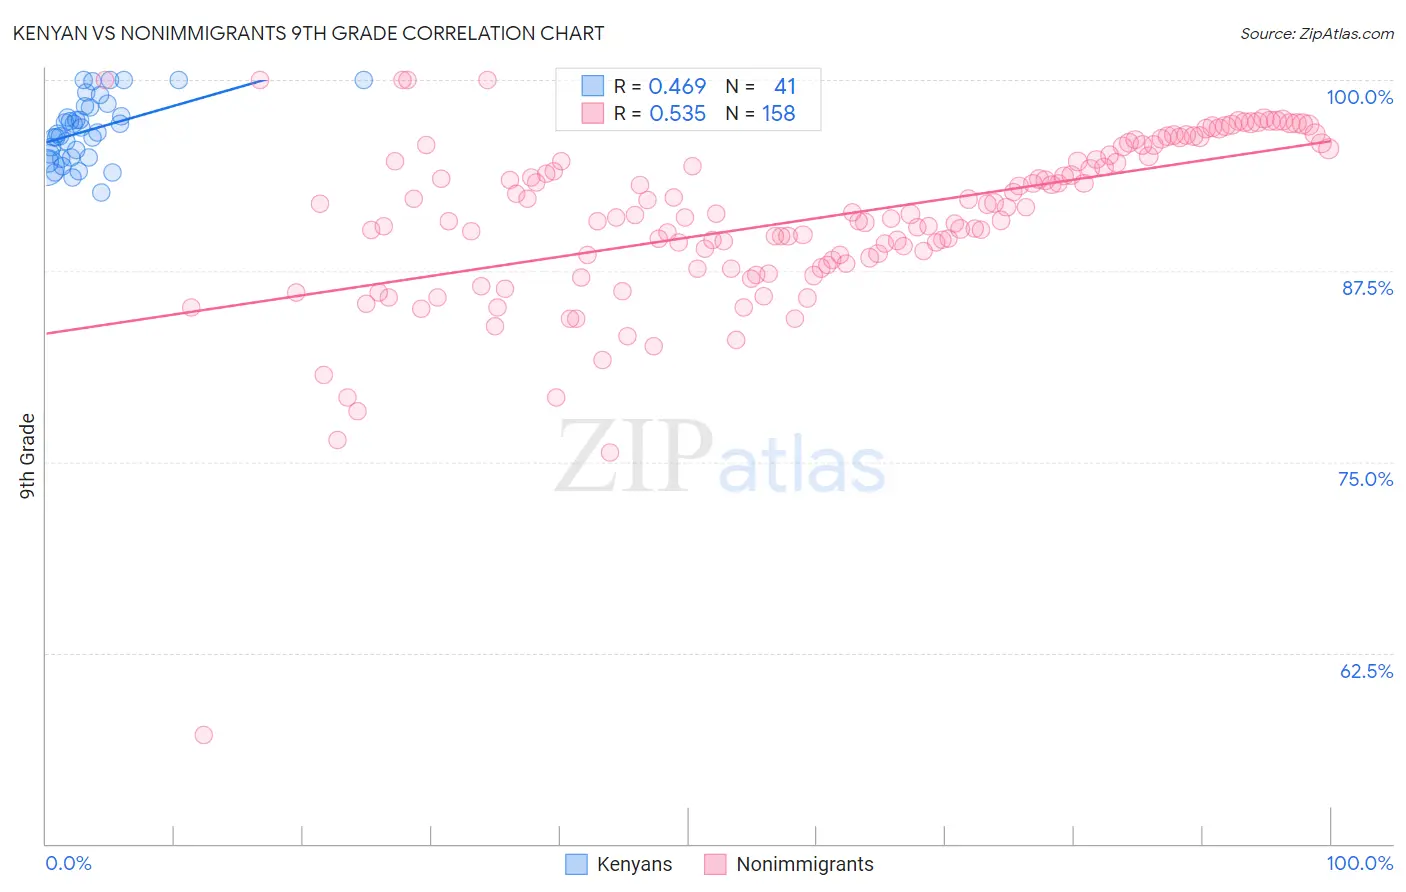
Kenyan vs Nonimmigrants 9th Grade Correlation Chart
The statistical analysis conducted on geographies consisting of 168,244,042 people shows a moderate positive correlation between the proportion of Kenyans and percentage of population with at least 9th grade education in the United States with a correlation coefficient (R) of 0.469 and weighted average of 95.1%. Similarly, the statistical analysis conducted on geographies consisting of 585,372,544 people shows a substantial positive correlation between the proportion of Nonimmigrants and percentage of population with at least 9th grade education in the United States with a correlation coefficient (R) of 0.535 and weighted average of 95.3%, a difference of 0.20%.
9th Grade Correlation Summary
| Measurement | Kenyan | Nonimmigrants |
| Minimum | 92.7% | 57.2% |
| Maximum | 100.0% | 100.0% |
| Range | 7.3% | 42.8% |
| Mean | 96.7% | 91.0% |
| Median | 96.6% | 91.2% |
| Interquartile 25% (IQ1) | 94.9% | 88.2% |
| Interquartile 75% (IQ3) | 98.3% | 95.0% |
| Interquartile Range (IQR) | 3.3% | 6.8% |
| Standard Deviation (Sample) | 2.0% | 5.6% |
| Standard Deviation (Population) | 2.0% | 5.6% |
Demographics Similar to Kenyans and Nonimmigrants by 9th Grade
In terms of 9th grade, the demographic groups most similar to Kenyans are Immigrants from Korea (95.1%, a difference of 0.010%), Immigrants from Jordan (95.1%, a difference of 0.020%), Cajun (95.1%, a difference of 0.020%), Choctaw (95.1%, a difference of 0.030%), and Pueblo (95.1%, a difference of 0.040%). Similarly, the demographic groups most similar to Nonimmigrants are Immigrants from North Macedonia (95.3%, a difference of 0.010%), Israeli (95.3%, a difference of 0.030%), Immigrants from Israel (95.3%, a difference of 0.050%), Immigrants from Belarus (95.2%, a difference of 0.070%), and Immigrants from Iran (95.2%, a difference of 0.080%).
| Demographics | Rating | Rank | 9th Grade |
| Immigrants | North Macedonia | 92.3 /100 | #131 | Exceptional 95.3% |
| Immigrants | Nonimmigrants | 92.0 /100 | #132 | Exceptional 95.3% |
| Israelis | 90.4 /100 | #133 | Exceptional 95.3% |
| Immigrants | Israel | 89.6 /100 | #134 | Excellent 95.3% |
| Immigrants | Belarus | 88.9 /100 | #135 | Excellent 95.2% |
| Immigrants | Iran | 88.3 /100 | #136 | Excellent 95.2% |
| Hmong | 87.7 /100 | #137 | Excellent 95.2% |
| Immigrants | Russia | 86.6 /100 | #138 | Excellent 95.2% |
| Immigrants | Eastern Europe | 85.8 /100 | #139 | Excellent 95.2% |
| Immigrants | Taiwan | 85.3 /100 | #140 | Excellent 95.2% |
| Immigrants | Bosnia and Herzegovina | 85.2 /100 | #141 | Excellent 95.2% |
| Immigrants | Greece | 84.6 /100 | #142 | Excellent 95.2% |
| Spanish | 84.4 /100 | #143 | Excellent 95.2% |
| Yup'ik | 83.3 /100 | #144 | Excellent 95.2% |
| Pueblo | 82.2 /100 | #145 | Excellent 95.1% |
| Immigrants | Sri Lanka | 82.1 /100 | #146 | Excellent 95.1% |
| Choctaw | 81.9 /100 | #147 | Excellent 95.1% |
| Immigrants | Jordan | 81.2 /100 | #148 | Excellent 95.1% |
| Immigrants | Korea | 79.6 /100 | #149 | Good 95.1% |
| Kenyans | 79.1 /100 | #150 | Good 95.1% |
| Cajuns | 77.3 /100 | #151 | Good 95.1% |