Hawaiian vs American 9th Grade
COMPARE
Hawaiian
American
9th Grade
9th Grade Comparison
Hawaiians
Americans
94.7%
9TH GRADE
22.7/ 100
METRIC RATING
198th/ 347
METRIC RANK
95.6%
9TH GRADE
98.5/ 100
METRIC RATING
95th/ 347
METRIC RANK
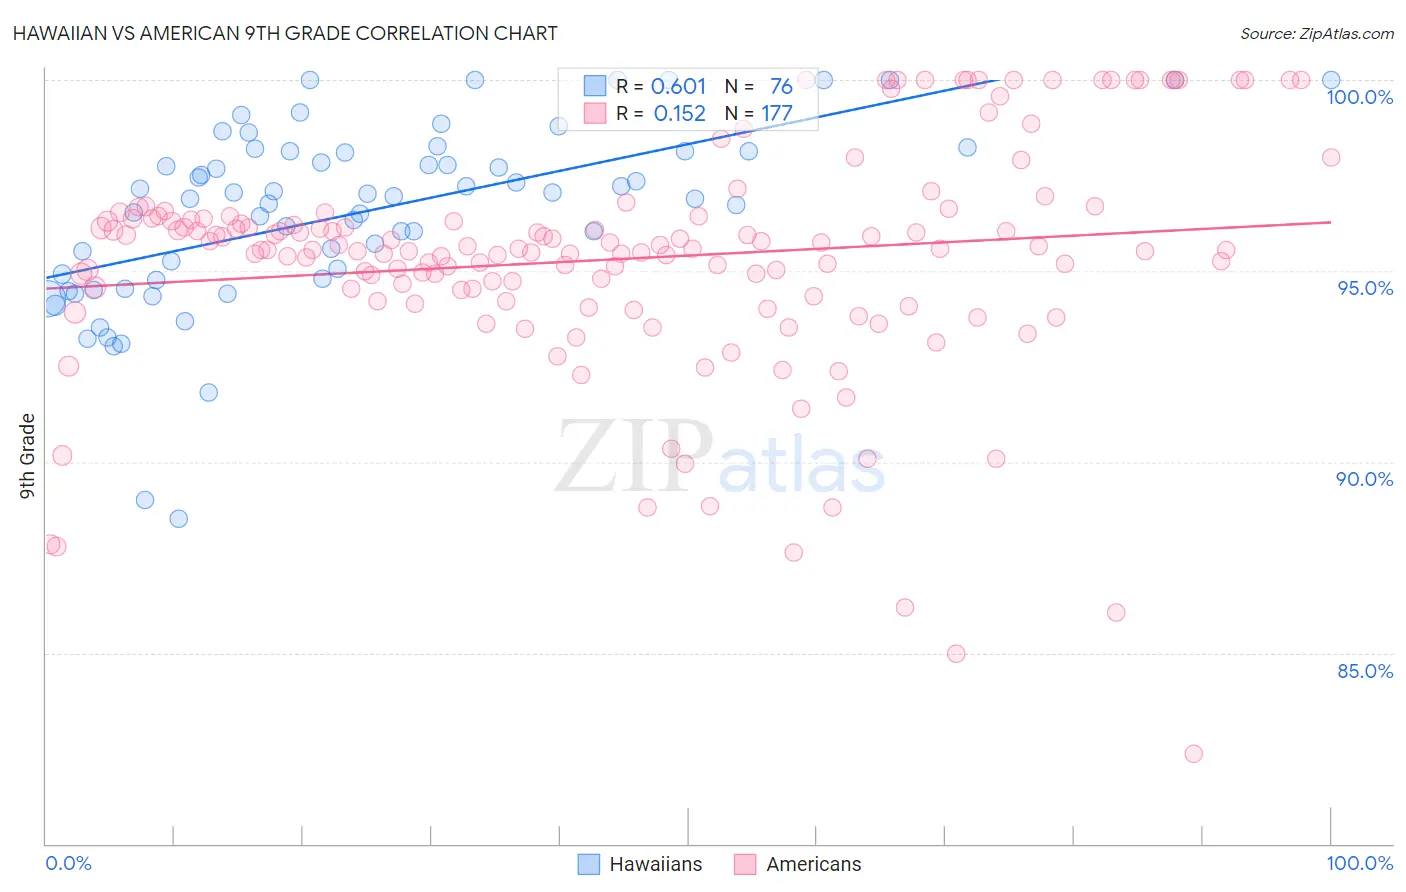
Hawaiian vs American 9th Grade Correlation Chart
The statistical analysis conducted on geographies consisting of 327,620,881 people shows a significant positive correlation between the proportion of Hawaiians and percentage of population with at least 9th grade education in the United States with a correlation coefficient (R) of 0.601 and weighted average of 94.7%. Similarly, the statistical analysis conducted on geographies consisting of 581,993,497 people shows a poor positive correlation between the proportion of Americans and percentage of population with at least 9th grade education in the United States with a correlation coefficient (R) of 0.152 and weighted average of 95.6%, a difference of 1.0%.
9th Grade Correlation Summary
| Measurement | Hawaiian | American |
| Minimum | 88.5% | 82.4% |
| Maximum | 100.0% | 100.0% |
| Range | 11.5% | 17.6% |
| Mean | 96.5% | 95.3% |
| Median | 97.0% | 95.6% |
| Interquartile 25% (IQ1) | 94.8% | 94.4% |
| Interquartile 75% (IQ3) | 98.1% | 96.4% |
| Interquartile Range (IQR) | 3.3% | 2.0% |
| Standard Deviation (Sample) | 2.4% | 3.0% |
| Standard Deviation (Population) | 2.4% | 3.0% |
Similar Demographics by 9th Grade
Demographics Similar to Hawaiians by 9th Grade
In terms of 9th grade, the demographic groups most similar to Hawaiians are Immigrants from Micronesia (94.7%, a difference of 0.020%), Laotian (94.6%, a difference of 0.020%), Immigrants from Zaire (94.6%, a difference of 0.020%), Black/African American (94.6%, a difference of 0.020%), and Immigrants from Eastern Asia (94.6%, a difference of 0.030%).
| Demographics | Rating | Rank | 9th Grade |
| Assyrians/Chaldeans/Syriacs | 32.0 /100 | #191 | Fair 94.7% |
| Immigrants | Northern Africa | 30.7 /100 | #192 | Fair 94.7% |
| Paraguayans | 30.1 /100 | #193 | Fair 94.7% |
| Panamanians | 29.0 /100 | #194 | Fair 94.7% |
| Marshallese | 27.9 /100 | #195 | Fair 94.7% |
| Immigrants | Lebanon | 27.2 /100 | #196 | Fair 94.7% |
| Immigrants | Micronesia | 24.7 /100 | #197 | Fair 94.7% |
| Hawaiians | 22.7 /100 | #198 | Fair 94.7% |
| Laotians | 21.0 /100 | #199 | Fair 94.6% |
| Immigrants | Zaire | 20.6 /100 | #200 | Fair 94.6% |
| Blacks/African Americans | 20.5 /100 | #201 | Fair 94.6% |
| Immigrants | Eastern Asia | 19.8 /100 | #202 | Poor 94.6% |
| Immigrants | Bahamas | 19.8 /100 | #203 | Poor 94.6% |
| Moroccans | 19.6 /100 | #204 | Poor 94.6% |
| Immigrants | Sudan | 17.6 /100 | #205 | Poor 94.6% |
Demographics Similar to Americans by 9th Grade
In terms of 9th grade, the demographic groups most similar to Americans are Filipino (95.6%, a difference of 0.010%), Delaware (95.6%, a difference of 0.010%), Immigrants from Germany (95.6%, a difference of 0.020%), Immigrants from Latvia (95.6%, a difference of 0.020%), and Immigrants from Japan (95.6%, a difference of 0.020%).
| Demographics | Rating | Rank | 9th Grade |
| Immigrants | Czechoslovakia | 98.9 /100 | #88 | Exceptional 95.7% |
| Yugoslavians | 98.9 /100 | #89 | Exceptional 95.7% |
| South Africans | 98.8 /100 | #90 | Exceptional 95.6% |
| Creek | 98.8 /100 | #91 | Exceptional 95.6% |
| Immigrants | Saudi Arabia | 98.8 /100 | #92 | Exceptional 95.6% |
| Immigrants | Germany | 98.7 /100 | #93 | Exceptional 95.6% |
| Immigrants | Latvia | 98.7 /100 | #94 | Exceptional 95.6% |
| Americans | 98.5 /100 | #95 | Exceptional 95.6% |
| Filipinos | 98.5 /100 | #96 | Exceptional 95.6% |
| Delaware | 98.4 /100 | #97 | Exceptional 95.6% |
| Immigrants | Japan | 98.4 /100 | #98 | Exceptional 95.6% |
| Menominee | 98.3 /100 | #99 | Exceptional 95.6% |
| Lebanese | 98.1 /100 | #100 | Exceptional 95.6% |
| Immigrants | Moldova | 97.9 /100 | #101 | Exceptional 95.5% |
| Immigrants | Switzerland | 97.7 /100 | #102 | Exceptional 95.5% |