Hawaiian vs Immigrants from Fiji 9th Grade
COMPARE
Hawaiian
Immigrants from Fiji
9th Grade
9th Grade Comparison
Hawaiians
Immigrants from Fiji
94.7%
9TH GRADE
22.7/ 100
METRIC RATING
198th/ 347
METRIC RANK
92.3%
9TH GRADE
0.0/ 100
METRIC RATING
311th/ 347
METRIC RANK
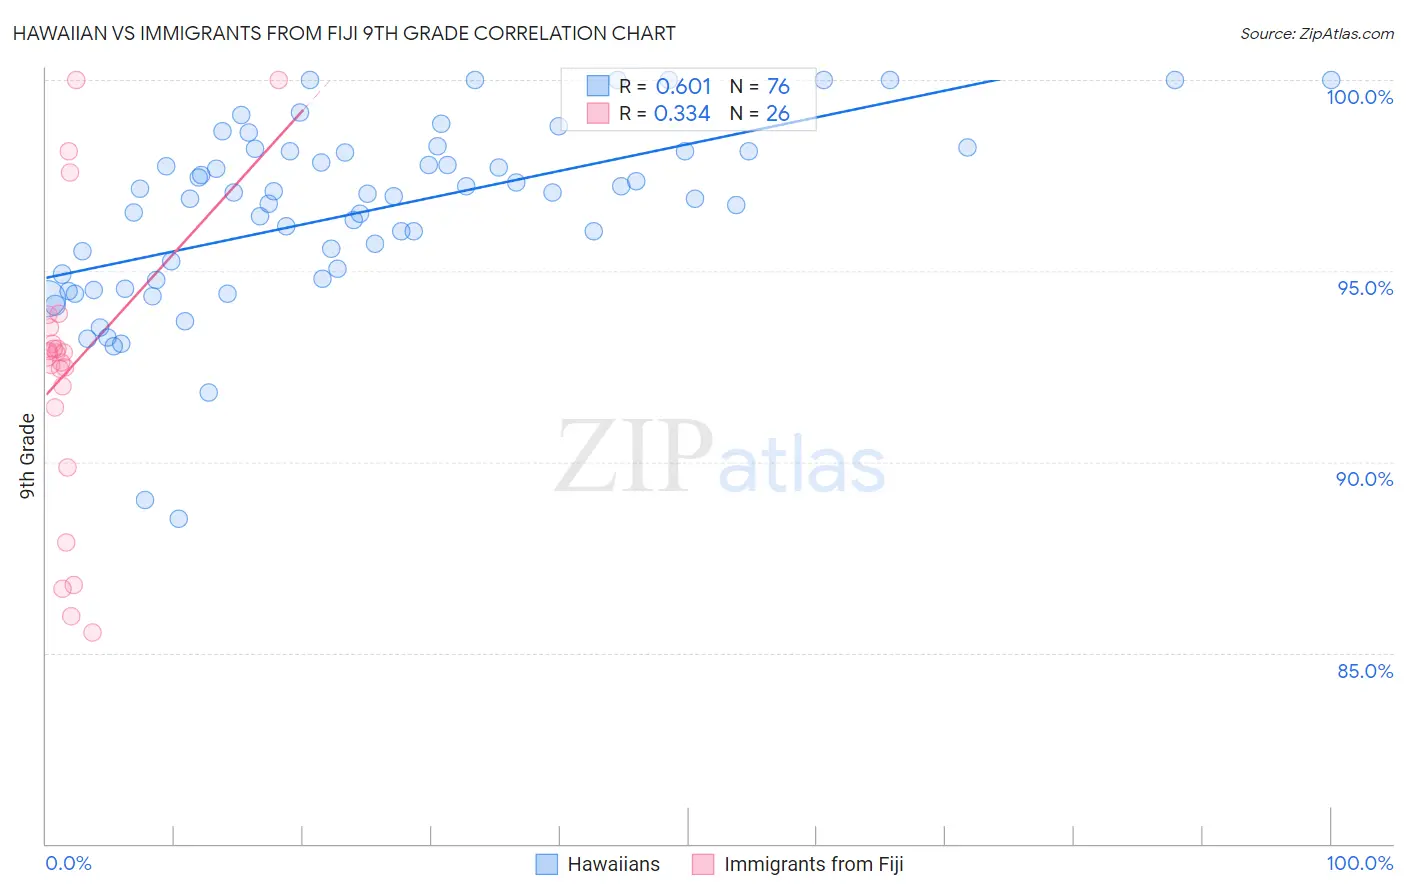
Hawaiian vs Immigrants from Fiji 9th Grade Correlation Chart
The statistical analysis conducted on geographies consisting of 327,620,881 people shows a significant positive correlation between the proportion of Hawaiians and percentage of population with at least 9th grade education in the United States with a correlation coefficient (R) of 0.601 and weighted average of 94.7%. Similarly, the statistical analysis conducted on geographies consisting of 93,756,204 people shows a mild positive correlation between the proportion of Immigrants from Fiji and percentage of population with at least 9th grade education in the United States with a correlation coefficient (R) of 0.334 and weighted average of 92.3%, a difference of 2.5%.
9th Grade Correlation Summary
| Measurement | Hawaiian | Immigrants from Fiji |
| Minimum | 88.5% | 85.5% |
| Maximum | 100.0% | 100.0% |
| Range | 11.5% | 14.5% |
| Mean | 96.5% | 92.4% |
| Median | 97.0% | 92.8% |
| Interquartile 25% (IQ1) | 94.8% | 91.4% |
| Interquartile 75% (IQ3) | 98.1% | 93.5% |
| Interquartile Range (IQR) | 3.3% | 2.1% |
| Standard Deviation (Sample) | 2.4% | 3.8% |
| Standard Deviation (Population) | 2.4% | 3.7% |
Similar Demographics by 9th Grade
Demographics Similar to Hawaiians by 9th Grade
In terms of 9th grade, the demographic groups most similar to Hawaiians are Immigrants from Micronesia (94.7%, a difference of 0.020%), Laotian (94.6%, a difference of 0.020%), Immigrants from Zaire (94.6%, a difference of 0.020%), Black/African American (94.6%, a difference of 0.020%), and Immigrants from Eastern Asia (94.6%, a difference of 0.030%).
| Demographics | Rating | Rank | 9th Grade |
| Assyrians/Chaldeans/Syriacs | 32.0 /100 | #191 | Fair 94.7% |
| Immigrants | Northern Africa | 30.7 /100 | #192 | Fair 94.7% |
| Paraguayans | 30.1 /100 | #193 | Fair 94.7% |
| Panamanians | 29.0 /100 | #194 | Fair 94.7% |
| Marshallese | 27.9 /100 | #195 | Fair 94.7% |
| Immigrants | Lebanon | 27.2 /100 | #196 | Fair 94.7% |
| Immigrants | Micronesia | 24.7 /100 | #197 | Fair 94.7% |
| Hawaiians | 22.7 /100 | #198 | Fair 94.7% |
| Laotians | 21.0 /100 | #199 | Fair 94.6% |
| Immigrants | Zaire | 20.6 /100 | #200 | Fair 94.6% |
| Blacks/African Americans | 20.5 /100 | #201 | Fair 94.6% |
| Immigrants | Eastern Asia | 19.8 /100 | #202 | Poor 94.6% |
| Immigrants | Bahamas | 19.8 /100 | #203 | Poor 94.6% |
| Moroccans | 19.6 /100 | #204 | Poor 94.6% |
| Immigrants | Sudan | 17.6 /100 | #205 | Poor 94.6% |
Demographics Similar to Immigrants from Fiji by 9th Grade
In terms of 9th grade, the demographic groups most similar to Immigrants from Fiji are Immigrants from Cambodia (92.4%, a difference of 0.030%), Houma (92.3%, a difference of 0.030%), Immigrants from Bangladesh (92.4%, a difference of 0.050%), Vietnamese (92.3%, a difference of 0.050%), and Immigrants from Portugal (92.2%, a difference of 0.090%).
| Demographics | Rating | Rank | 9th Grade |
| Tohono O'odham | 0.0 /100 | #304 | Tragic 92.6% |
| Japanese | 0.0 /100 | #305 | Tragic 92.6% |
| Immigrants | Vietnam | 0.0 /100 | #306 | Tragic 92.6% |
| Immigrants | Immigrants | 0.0 /100 | #307 | Tragic 92.5% |
| Immigrants | Guyana | 0.0 /100 | #308 | Tragic 92.5% |
| Immigrants | Bangladesh | 0.0 /100 | #309 | Tragic 92.4% |
| Immigrants | Cambodia | 0.0 /100 | #310 | Tragic 92.4% |
| Immigrants | Fiji | 0.0 /100 | #311 | Tragic 92.3% |
| Houma | 0.0 /100 | #312 | Tragic 92.3% |
| Vietnamese | 0.0 /100 | #313 | Tragic 92.3% |
| Immigrants | Portugal | 0.0 /100 | #314 | Tragic 92.2% |
| Immigrants | Caribbean | 0.0 /100 | #315 | Tragic 92.2% |
| Cape Verdeans | 0.0 /100 | #316 | Tragic 92.2% |
| Immigrants | Cuba | 0.0 /100 | #317 | Tragic 92.2% |
| Nepalese | 0.0 /100 | #318 | Tragic 92.0% |