Hawaiian vs Nonimmigrants Householder Income Ages 45 - 64 years
COMPARE
Hawaiian
Nonimmigrants
Householder Income Ages 45 - 64 years
Householder Income Ages 45 - 64 years Comparison
Hawaiians
Nonimmigrants
$98,778
HOUSEHOLDER INCOME AGES 45 - 64 YEARS
31.6/ 100
METRIC RATING
193rd/ 347
METRIC RANK
$94,448
HOUSEHOLDER INCOME AGES 45 - 64 YEARS
5.0/ 100
METRIC RATING
223rd/ 347
METRIC RANK
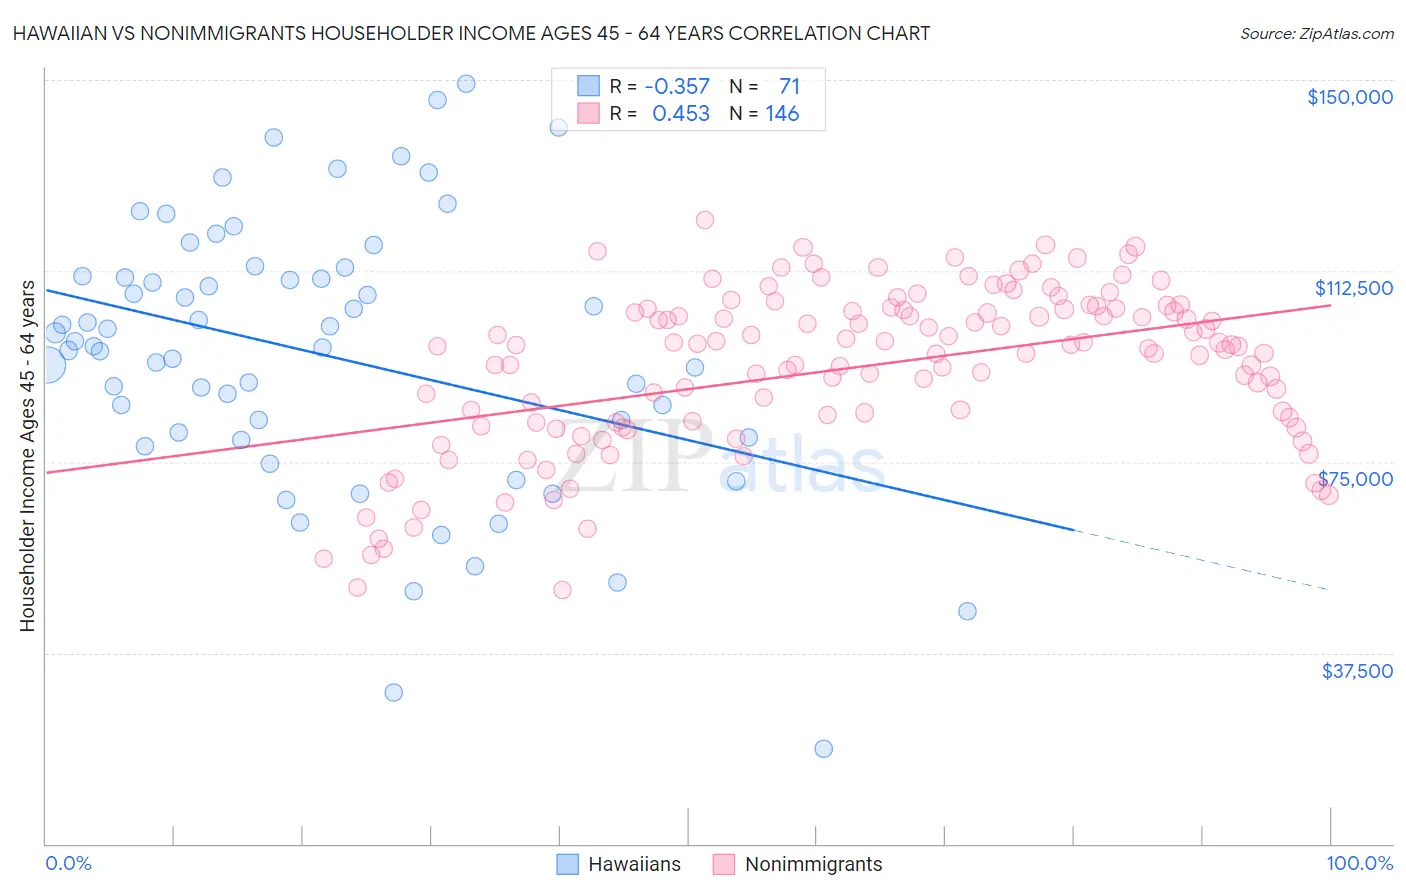
Hawaiian vs Nonimmigrants Householder Income Ages 45 - 64 years Correlation Chart
The statistical analysis conducted on geographies consisting of 327,005,411 people shows a mild negative correlation between the proportion of Hawaiians and household income with householder between the ages 45 and 64 in the United States with a correlation coefficient (R) of -0.357 and weighted average of $98,778. Similarly, the statistical analysis conducted on geographies consisting of 578,858,945 people shows a moderate positive correlation between the proportion of Nonimmigrants and household income with householder between the ages 45 and 64 in the United States with a correlation coefficient (R) of 0.453 and weighted average of $94,448, a difference of 4.6%.
Householder Income Ages 45 - 64 years Correlation Summary
| Measurement | Hawaiian | Nonimmigrants |
| Minimum | $18,640 | $49,742 |
| Maximum | $149,180 | $122,626 |
| Range | $130,540 | $72,884 |
| Mean | $96,039 | $93,614 |
| Median | $97,593 | $97,642 |
| Interquartile 25% (IQ1) | $79,762 | $82,744 |
| Interquartile 75% (IQ3) | $111,438 | $104,952 |
| Interquartile Range (IQR) | $31,676 | $22,209 |
| Standard Deviation (Sample) | $26,677 | $15,816 |
| Standard Deviation (Population) | $26,488 | $15,762 |
Similar Demographics by Householder Income Ages 45 - 64 years
Demographics Similar to Hawaiians by Householder Income Ages 45 - 64 years
In terms of householder income ages 45 - 64 years, the demographic groups most similar to Hawaiians are Celtic ($98,896, a difference of 0.12%), Uruguayan ($98,660, a difference of 0.12%), Kenyan ($98,970, a difference of 0.19%), Spanish ($98,554, a difference of 0.23%), and French Canadian ($99,093, a difference of 0.32%).
| Demographics | Rating | Rank | Householder Income Ages 45 - 64 years |
| Dutch | 41.7 /100 | #186 | Average $99,650 |
| Iraqis | 38.5 /100 | #187 | Fair $99,387 |
| Immigrants | Portugal | 36.3 /100 | #188 | Fair $99,203 |
| Immigrants | South America | 35.4 /100 | #189 | Fair $99,126 |
| French Canadians | 35.1 /100 | #190 | Fair $99,093 |
| Kenyans | 33.7 /100 | #191 | Fair $98,970 |
| Celtics | 32.9 /100 | #192 | Fair $98,896 |
| Hawaiians | 31.6 /100 | #193 | Fair $98,778 |
| Uruguayans | 30.3 /100 | #194 | Fair $98,660 |
| Spanish | 29.2 /100 | #195 | Fair $98,554 |
| Immigrants | Eastern Africa | 28.3 /100 | #196 | Fair $98,467 |
| Puget Sound Salish | 27.0 /100 | #197 | Fair $98,340 |
| Immigrants | Iraq | 25.7 /100 | #198 | Fair $98,201 |
| Whites/Caucasians | 24.6 /100 | #199 | Fair $98,091 |
| Immigrants | Kenya | 23.5 /100 | #200 | Fair $97,964 |
Demographics Similar to Nonimmigrants by Householder Income Ages 45 - 64 years
In terms of householder income ages 45 - 64 years, the demographic groups most similar to Nonimmigrants are Malaysian ($94,517, a difference of 0.070%), Immigrants from Bosnia and Herzegovina ($94,288, a difference of 0.17%), Bermudan ($94,197, a difference of 0.27%), Immigrants from the Azores ($94,138, a difference of 0.33%), and Immigrants from Nigeria ($94,804, a difference of 0.38%).
| Demographics | Rating | Rank | Householder Income Ages 45 - 64 years |
| Immigrants | Venezuela | 7.6 /100 | #216 | Tragic $95,342 |
| Immigrants | Ghana | 6.4 /100 | #217 | Tragic $94,982 |
| Delaware | 6.2 /100 | #218 | Tragic $94,914 |
| Immigrants | Armenia | 6.1 /100 | #219 | Tragic $94,863 |
| Salvadorans | 6.0 /100 | #220 | Tragic $94,842 |
| Immigrants | Nigeria | 5.9 /100 | #221 | Tragic $94,804 |
| Malaysians | 5.2 /100 | #222 | Tragic $94,517 |
| Immigrants | Nonimmigrants | 5.0 /100 | #223 | Tragic $94,448 |
| Immigrants | Bosnia and Herzegovina | 4.6 /100 | #224 | Tragic $94,288 |
| Bermudans | 4.4 /100 | #225 | Tragic $94,197 |
| Immigrants | Azores | 4.3 /100 | #226 | Tragic $94,138 |
| Alaska Natives | 4.0 /100 | #227 | Tragic $93,991 |
| Immigrants | Panama | 3.7 /100 | #228 | Tragic $93,815 |
| Vietnamese | 3.6 /100 | #229 | Tragic $93,788 |
| Immigrants | Sudan | 3.6 /100 | #230 | Tragic $93,781 |