Hawaiian vs Immigrants from Africa 9th Grade
COMPARE
Hawaiian
Immigrants from Africa
9th Grade
9th Grade Comparison
Hawaiians
Immigrants from Africa
94.7%
9TH GRADE
22.7/ 100
METRIC RATING
198th/ 347
METRIC RANK
94.3%
9TH GRADE
3.9/ 100
METRIC RATING
232nd/ 347
METRIC RANK
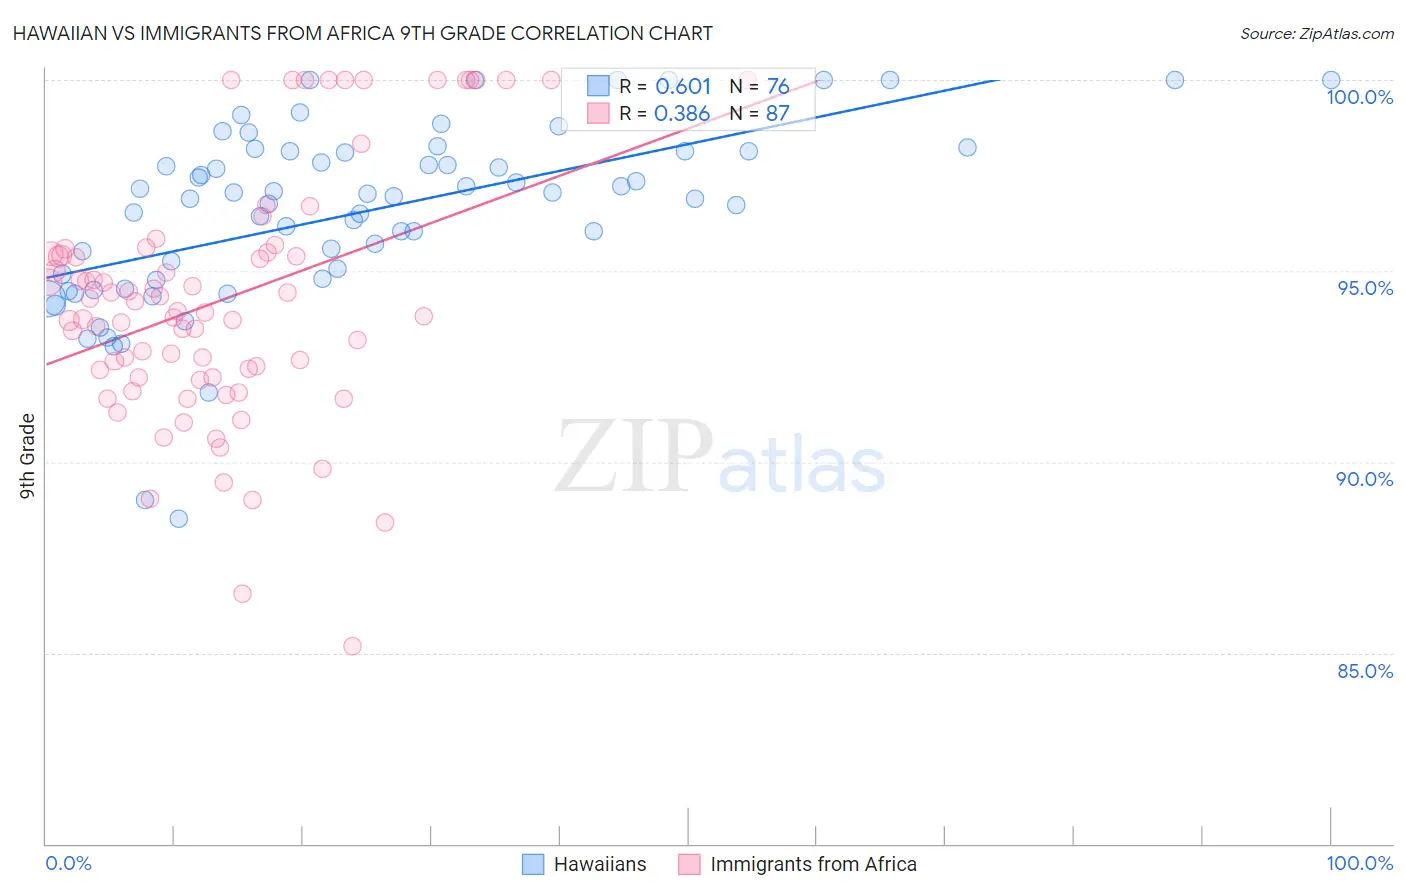
Hawaiian vs Immigrants from Africa 9th Grade Correlation Chart
The statistical analysis conducted on geographies consisting of 327,620,881 people shows a significant positive correlation between the proportion of Hawaiians and percentage of population with at least 9th grade education in the United States with a correlation coefficient (R) of 0.601 and weighted average of 94.7%. Similarly, the statistical analysis conducted on geographies consisting of 469,381,733 people shows a mild positive correlation between the proportion of Immigrants from Africa and percentage of population with at least 9th grade education in the United States with a correlation coefficient (R) of 0.386 and weighted average of 94.3%, a difference of 0.37%.
9th Grade Correlation Summary
| Measurement | Hawaiian | Immigrants from Africa |
| Minimum | 88.5% | 85.2% |
| Maximum | 100.0% | 100.0% |
| Range | 11.5% | 14.8% |
| Mean | 96.5% | 94.2% |
| Median | 97.0% | 93.9% |
| Interquartile 25% (IQ1) | 94.8% | 92.2% |
| Interquartile 75% (IQ3) | 98.1% | 95.5% |
| Interquartile Range (IQR) | 3.3% | 3.3% |
| Standard Deviation (Sample) | 2.4% | 3.2% |
| Standard Deviation (Population) | 2.4% | 3.2% |
Similar Demographics by 9th Grade
Demographics Similar to Hawaiians by 9th Grade
In terms of 9th grade, the demographic groups most similar to Hawaiians are Immigrants from Micronesia (94.7%, a difference of 0.020%), Laotian (94.6%, a difference of 0.020%), Immigrants from Zaire (94.6%, a difference of 0.020%), Black/African American (94.6%, a difference of 0.020%), and Immigrants from Eastern Asia (94.6%, a difference of 0.030%).
| Demographics | Rating | Rank | 9th Grade |
| Assyrians/Chaldeans/Syriacs | 32.0 /100 | #191 | Fair 94.7% |
| Immigrants | Northern Africa | 30.7 /100 | #192 | Fair 94.7% |
| Paraguayans | 30.1 /100 | #193 | Fair 94.7% |
| Panamanians | 29.0 /100 | #194 | Fair 94.7% |
| Marshallese | 27.9 /100 | #195 | Fair 94.7% |
| Immigrants | Lebanon | 27.2 /100 | #196 | Fair 94.7% |
| Immigrants | Micronesia | 24.7 /100 | #197 | Fair 94.7% |
| Hawaiians | 22.7 /100 | #198 | Fair 94.7% |
| Laotians | 21.0 /100 | #199 | Fair 94.6% |
| Immigrants | Zaire | 20.6 /100 | #200 | Fair 94.6% |
| Blacks/African Americans | 20.5 /100 | #201 | Fair 94.6% |
| Immigrants | Eastern Asia | 19.8 /100 | #202 | Poor 94.6% |
| Immigrants | Bahamas | 19.8 /100 | #203 | Poor 94.6% |
| Moroccans | 19.6 /100 | #204 | Poor 94.6% |
| Immigrants | Sudan | 17.6 /100 | #205 | Poor 94.6% |
Demographics Similar to Immigrants from Africa by 9th Grade
In terms of 9th grade, the demographic groups most similar to Immigrants from Africa are Apache (94.3%, a difference of 0.010%), Immigrants from Panama (94.3%, a difference of 0.010%), Nigerian (94.3%, a difference of 0.010%), Costa Rican (94.3%, a difference of 0.020%), and Immigrants from Southern Europe (94.3%, a difference of 0.030%).
| Demographics | Rating | Rank | 9th Grade |
| Ethiopians | 5.4 /100 | #225 | Tragic 94.4% |
| Sub-Saharan Africans | 5.4 /100 | #226 | Tragic 94.4% |
| Immigrants | Sierra Leone | 4.8 /100 | #227 | Tragic 94.4% |
| Lumbee | 4.7 /100 | #228 | Tragic 94.4% |
| Immigrants | Southern Europe | 4.5 /100 | #229 | Tragic 94.3% |
| Apache | 4.2 /100 | #230 | Tragic 94.3% |
| Immigrants | Panama | 4.0 /100 | #231 | Tragic 94.3% |
| Immigrants | Africa | 3.9 /100 | #232 | Tragic 94.3% |
| Nigerians | 3.7 /100 | #233 | Tragic 94.3% |
| Costa Ricans | 3.5 /100 | #234 | Tragic 94.3% |
| Bolivians | 3.3 /100 | #235 | Tragic 94.3% |
| Somalis | 2.9 /100 | #236 | Tragic 94.3% |
| Koreans | 2.9 /100 | #237 | Tragic 94.3% |
| South American Indians | 2.8 /100 | #238 | Tragic 94.3% |
| Immigrants | China | 2.8 /100 | #239 | Tragic 94.3% |