Crow vs Nonimmigrants 9th Grade
COMPARE
Crow
Nonimmigrants
9th Grade
9th Grade Comparison
Crow
Nonimmigrants
96.1%
9TH GRADE
99.9/ 100
METRIC RATING
45th/ 347
METRIC RANK
95.3%
9TH GRADE
92.0/ 100
METRIC RATING
132nd/ 347
METRIC RANK
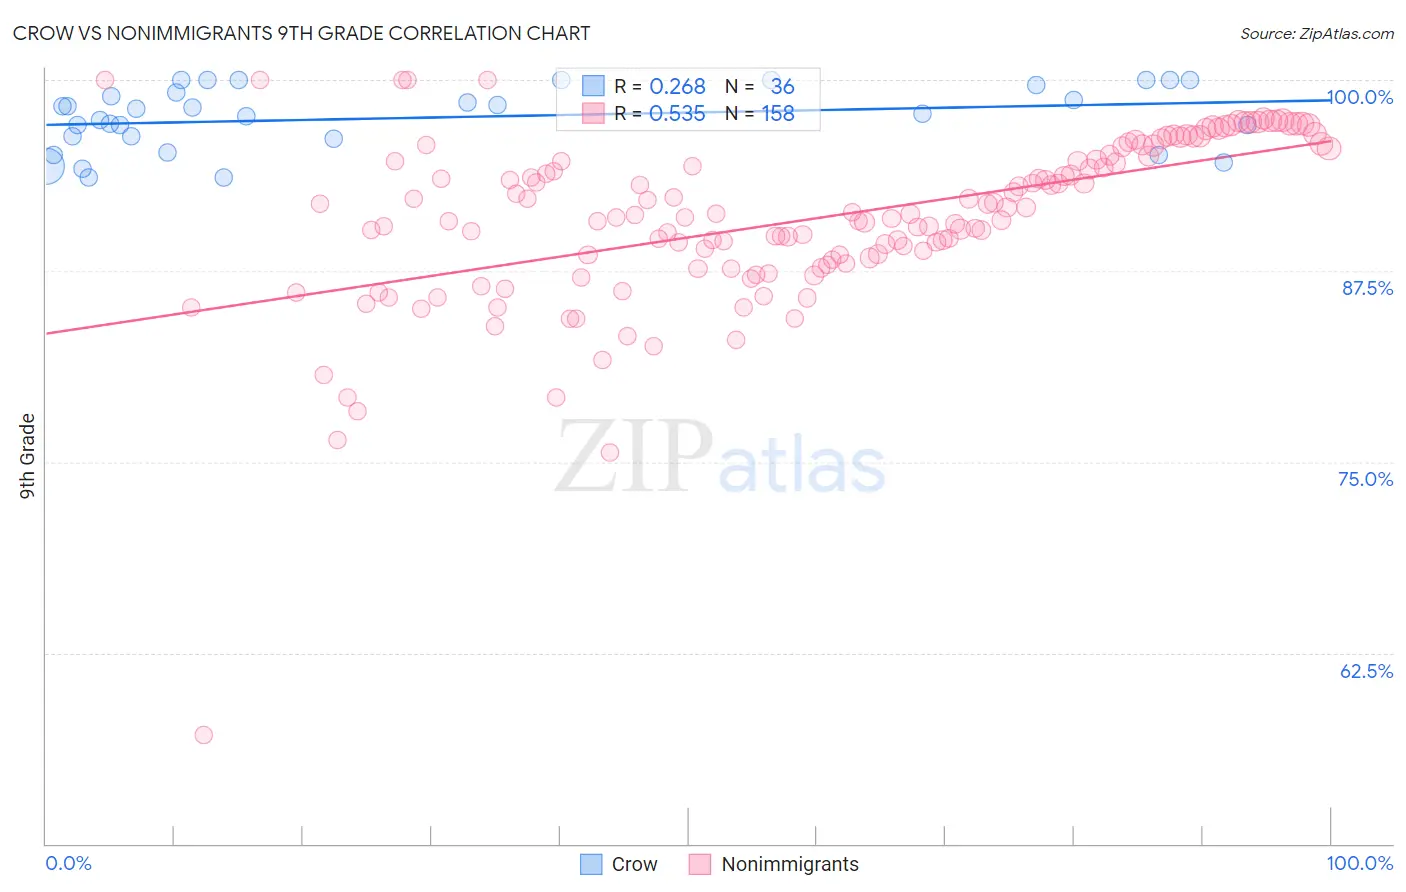
Crow vs Nonimmigrants 9th Grade Correlation Chart
The statistical analysis conducted on geographies consisting of 59,209,980 people shows a weak positive correlation between the proportion of Crow and percentage of population with at least 9th grade education in the United States with a correlation coefficient (R) of 0.268 and weighted average of 96.1%. Similarly, the statistical analysis conducted on geographies consisting of 585,372,544 people shows a substantial positive correlation between the proportion of Nonimmigrants and percentage of population with at least 9th grade education in the United States with a correlation coefficient (R) of 0.535 and weighted average of 95.3%, a difference of 0.80%.
9th Grade Correlation Summary
| Measurement | Crow | Nonimmigrants |
| Minimum | 93.6% | 57.2% |
| Maximum | 100.0% | 100.0% |
| Range | 6.4% | 42.8% |
| Mean | 97.5% | 91.0% |
| Median | 97.9% | 91.2% |
| Interquartile 25% (IQ1) | 96.3% | 88.2% |
| Interquartile 75% (IQ3) | 99.4% | 95.0% |
| Interquartile Range (IQR) | 3.2% | 6.8% |
| Standard Deviation (Sample) | 2.0% | 5.6% |
| Standard Deviation (Population) | 2.0% | 5.6% |
Similar Demographics by 9th Grade
Demographics Similar to Crow by 9th Grade
In terms of 9th grade, the demographic groups most similar to Crow are Immigrants from India (96.1%, a difference of 0.0%), Alaska Native (96.1%, a difference of 0.010%), Russian (96.0%, a difference of 0.010%), Australian (96.0%, a difference of 0.010%), and Greek (96.0%, a difference of 0.020%).
| Demographics | Rating | Rank | 9th Grade |
| Immigrants | Scotland | 99.9 /100 | #38 | Exceptional 96.1% |
| Ottawa | 99.9 /100 | #39 | Exceptional 96.1% |
| Slavs | 99.9 /100 | #40 | Exceptional 96.1% |
| Czechoslovakians | 99.9 /100 | #41 | Exceptional 96.1% |
| Chippewa | 99.9 /100 | #42 | Exceptional 96.1% |
| Iranians | 99.9 /100 | #43 | Exceptional 96.1% |
| Alaska Natives | 99.9 /100 | #44 | Exceptional 96.1% |
| Crow | 99.9 /100 | #45 | Exceptional 96.1% |
| Immigrants | India | 99.9 /100 | #46 | Exceptional 96.1% |
| Russians | 99.9 /100 | #47 | Exceptional 96.0% |
| Australians | 99.9 /100 | #48 | Exceptional 96.0% |
| Greeks | 99.9 /100 | #49 | Exceptional 96.0% |
| Celtics | 99.9 /100 | #50 | Exceptional 96.0% |
| Immigrants | Northern Europe | 99.9 /100 | #51 | Exceptional 96.0% |
| Serbians | 99.9 /100 | #52 | Exceptional 96.0% |
Demographics Similar to Nonimmigrants by 9th Grade
In terms of 9th grade, the demographic groups most similar to Nonimmigrants are Immigrants from North Macedonia (95.3%, a difference of 0.010%), Israeli (95.3%, a difference of 0.030%), Jordanian (95.3%, a difference of 0.040%), Immigrants from Israel (95.3%, a difference of 0.050%), and Immigrants from Hungary (95.4%, a difference of 0.060%).
| Demographics | Rating | Rank | 9th Grade |
| Immigrants | South Central Asia | 95.1 /100 | #125 | Exceptional 95.4% |
| Immigrants | Serbia | 94.4 /100 | #126 | Exceptional 95.4% |
| Palestinians | 94.3 /100 | #127 | Exceptional 95.4% |
| Immigrants | Hungary | 94.2 /100 | #128 | Exceptional 95.4% |
| Basques | 94.1 /100 | #129 | Exceptional 95.4% |
| Jordanians | 93.5 /100 | #130 | Exceptional 95.3% |
| Immigrants | North Macedonia | 92.3 /100 | #131 | Exceptional 95.3% |
| Immigrants | Nonimmigrants | 92.0 /100 | #132 | Exceptional 95.3% |
| Israelis | 90.4 /100 | #133 | Exceptional 95.3% |
| Immigrants | Israel | 89.6 /100 | #134 | Excellent 95.3% |
| Immigrants | Belarus | 88.9 /100 | #135 | Excellent 95.2% |
| Immigrants | Iran | 88.3 /100 | #136 | Excellent 95.2% |
| Hmong | 87.7 /100 | #137 | Excellent 95.2% |
| Immigrants | Russia | 86.6 /100 | #138 | Excellent 95.2% |
| Immigrants | Eastern Europe | 85.8 /100 | #139 | Excellent 95.2% |