Immigrants from El Salvador vs Immigrants from Colombia College, Under 1 year
COMPARE
Immigrants from El Salvador
Immigrants from Colombia
College, Under 1 year
College, Under 1 year Comparison
Immigrants from El Salvador
Immigrants from Colombia
56.4%
COLLEGE, UNDER 1 YEAR
0.0/ 100
METRIC RATING
324th/ 347
METRIC RANK
63.1%
COLLEGE, UNDER 1 YEAR
4.0/ 100
METRIC RATING
226th/ 347
METRIC RANK
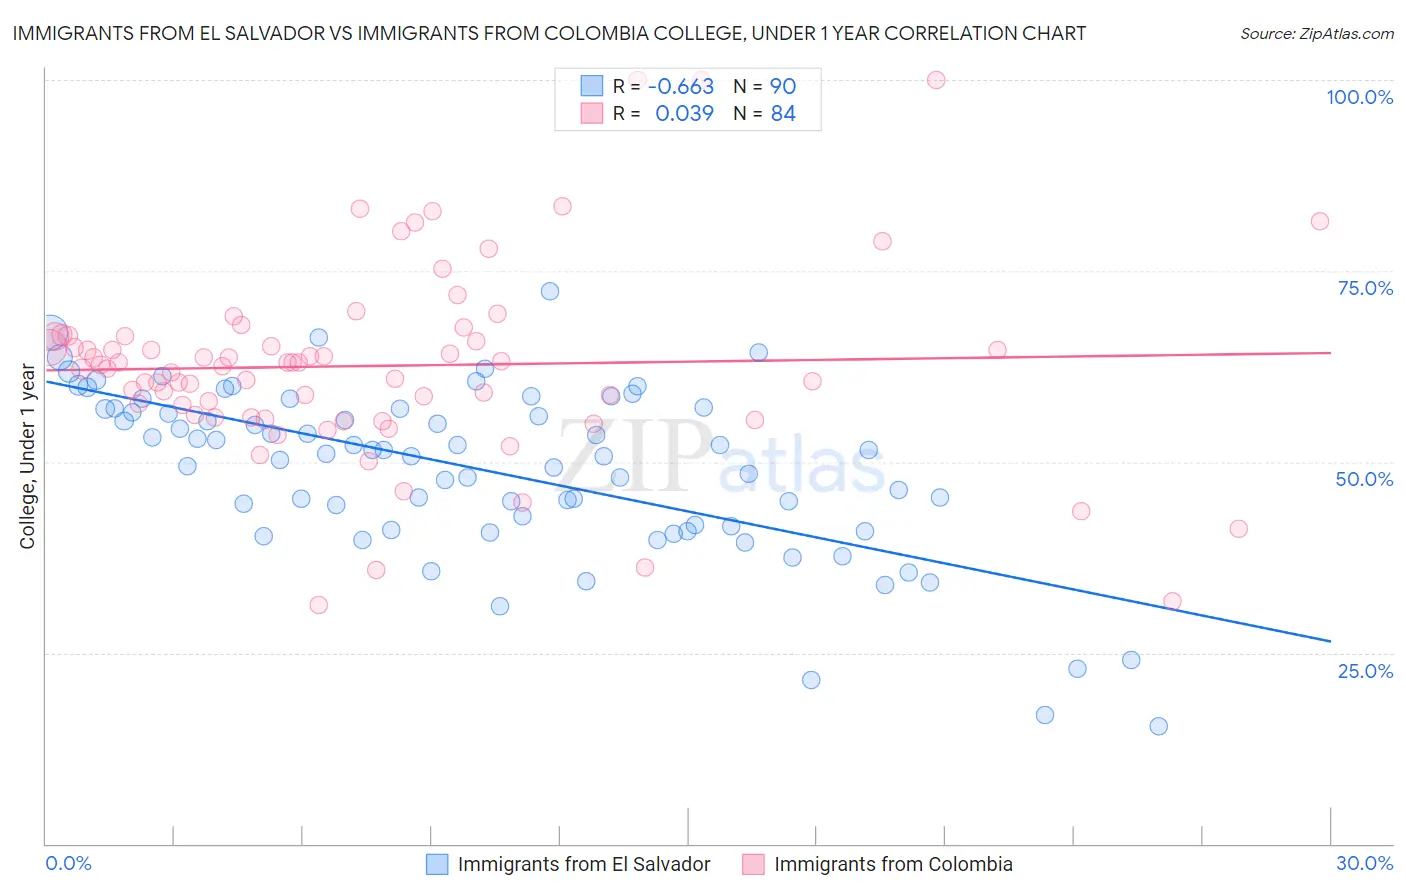
Immigrants from El Salvador vs Immigrants from Colombia College, Under 1 year Correlation Chart
The statistical analysis conducted on geographies consisting of 357,850,135 people shows a significant negative correlation between the proportion of Immigrants from El Salvador and percentage of population with at least college, under 1 year education in the United States with a correlation coefficient (R) of -0.663 and weighted average of 56.4%. Similarly, the statistical analysis conducted on geographies consisting of 378,689,260 people shows no correlation between the proportion of Immigrants from Colombia and percentage of population with at least college, under 1 year education in the United States with a correlation coefficient (R) of 0.039 and weighted average of 63.1%, a difference of 11.9%.
College, Under 1 year Correlation Summary
| Measurement | Immigrants from El Salvador | Immigrants from Colombia |
| Minimum | 15.3% | 31.3% |
| Maximum | 72.3% | 100.0% |
| Range | 56.9% | 68.7% |
| Mean | 48.9% | 62.6% |
| Median | 51.3% | 62.6% |
| Interquartile 25% (IQ1) | 41.6% | 56.0% |
| Interquartile 75% (IQ3) | 57.0% | 66.5% |
| Interquartile Range (IQR) | 15.4% | 10.4% |
| Standard Deviation (Sample) | 11.1% | 12.8% |
| Standard Deviation (Population) | 11.1% | 12.7% |
Similar Demographics by College, Under 1 year
Demographics Similar to Immigrants from El Salvador by College, Under 1 year
In terms of college, under 1 year, the demographic groups most similar to Immigrants from El Salvador are Immigrants from Latin America (56.3%, a difference of 0.10%), Immigrants from Honduras (56.5%, a difference of 0.13%), Navajo (56.3%, a difference of 0.25%), Immigrants from Caribbean (56.6%, a difference of 0.31%), and Immigrants from Guatemala (56.2%, a difference of 0.34%).
| Demographics | Rating | Rank | College, Under 1 year |
| Hispanics or Latinos | 0.0 /100 | #317 | Tragic 57.0% |
| Immigrants | Haiti | 0.0 /100 | #318 | Tragic 56.9% |
| Puerto Ricans | 0.0 /100 | #319 | Tragic 56.8% |
| Guatemalans | 0.0 /100 | #320 | Tragic 56.8% |
| Natives/Alaskans | 0.0 /100 | #321 | Tragic 56.6% |
| Immigrants | Caribbean | 0.0 /100 | #322 | Tragic 56.6% |
| Immigrants | Honduras | 0.0 /100 | #323 | Tragic 56.5% |
| Immigrants | El Salvador | 0.0 /100 | #324 | Tragic 56.4% |
| Immigrants | Latin America | 0.0 /100 | #325 | Tragic 56.3% |
| Navajo | 0.0 /100 | #326 | Tragic 56.3% |
| Immigrants | Guatemala | 0.0 /100 | #327 | Tragic 56.2% |
| Cape Verdeans | 0.0 /100 | #328 | Tragic 56.0% |
| Immigrants | Cuba | 0.0 /100 | #329 | Tragic 55.7% |
| Mexicans | 0.0 /100 | #330 | Tragic 55.6% |
| Dominicans | 0.0 /100 | #331 | Tragic 55.5% |
Demographics Similar to Immigrants from Colombia by College, Under 1 year
In terms of college, under 1 year, the demographic groups most similar to Immigrants from Colombia are Immigrants from Peru (63.1%, a difference of 0.020%), Immigrants from Ghana (63.1%, a difference of 0.090%), Subsaharan African (63.2%, a difference of 0.12%), Immigrants from Costa Rica (63.2%, a difference of 0.15%), and Samoan (63.0%, a difference of 0.20%).
| Demographics | Rating | Rank | College, Under 1 year |
| Immigrants | Fiji | 5.7 /100 | #219 | Tragic 63.4% |
| Portuguese | 5.6 /100 | #220 | Tragic 63.4% |
| Cree | 5.2 /100 | #221 | Tragic 63.3% |
| Immigrants | Senegal | 5.0 /100 | #222 | Tragic 63.3% |
| Immigrants | Costa Rica | 4.5 /100 | #223 | Tragic 63.2% |
| Sub-Saharan Africans | 4.4 /100 | #224 | Tragic 63.2% |
| Immigrants | Peru | 4.0 /100 | #225 | Tragic 63.1% |
| Immigrants | Colombia | 4.0 /100 | #226 | Tragic 63.1% |
| Immigrants | Ghana | 3.7 /100 | #227 | Tragic 63.1% |
| Samoans | 3.3 /100 | #228 | Tragic 63.0% |
| Liberians | 3.2 /100 | #229 | Tragic 63.0% |
| Immigrants | Nonimmigrants | 3.0 /100 | #230 | Tragic 62.9% |
| Immigrants | Western Africa | 2.4 /100 | #231 | Tragic 62.8% |
| Osage | 2.2 /100 | #232 | Tragic 62.7% |
| Iroquois | 2.0 /100 | #233 | Tragic 62.6% |