Immigrants from St. Vincent and the Grenadines vs Immigrants from Colombia College, Under 1 year
COMPARE
Immigrants from St. Vincent and the Grenadines
Immigrants from Colombia
College, Under 1 year
College, Under 1 year Comparison
Immigrants from St. Vincent and the Grenadines
Immigrants from Colombia
59.6%
COLLEGE, UNDER 1 YEAR
0.0/ 100
METRIC RATING
284th/ 347
METRIC RANK
63.1%
COLLEGE, UNDER 1 YEAR
4.0/ 100
METRIC RATING
226th/ 347
METRIC RANK
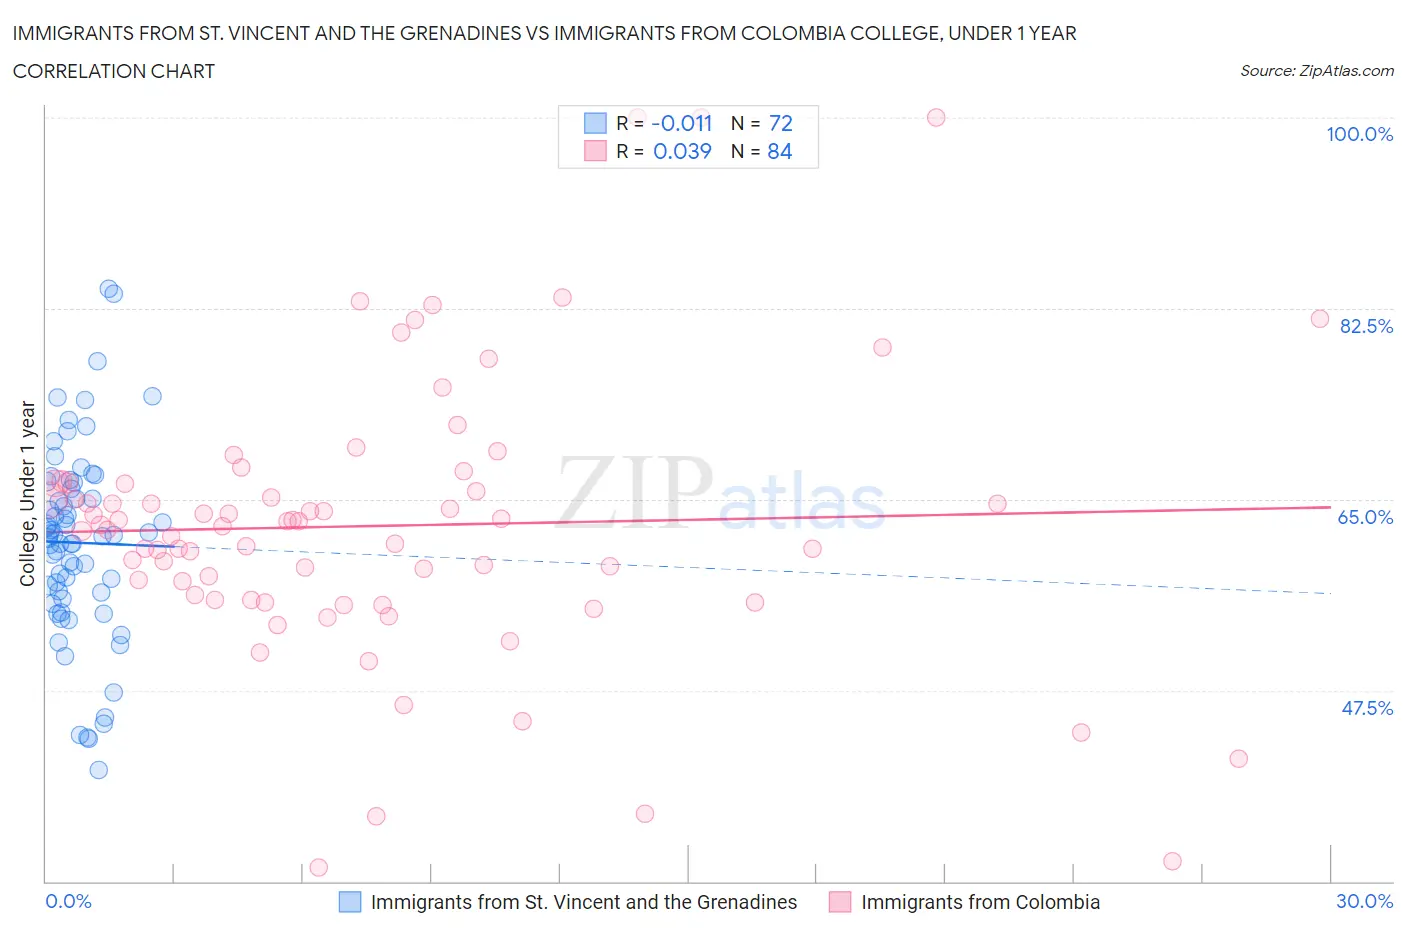
Immigrants from St. Vincent and the Grenadines vs Immigrants from Colombia College, Under 1 year Correlation Chart
The statistical analysis conducted on geographies consisting of 56,185,220 people shows no correlation between the proportion of Immigrants from St. Vincent and the Grenadines and percentage of population with at least college, under 1 year education in the United States with a correlation coefficient (R) of -0.011 and weighted average of 59.6%. Similarly, the statistical analysis conducted on geographies consisting of 378,689,260 people shows no correlation between the proportion of Immigrants from Colombia and percentage of population with at least college, under 1 year education in the United States with a correlation coefficient (R) of 0.039 and weighted average of 63.1%, a difference of 5.8%.
College, Under 1 year Correlation Summary
| Measurement | Immigrants from St. Vincent and the Grenadines | Immigrants from Colombia |
| Minimum | 40.2% | 31.3% |
| Maximum | 84.3% | 100.0% |
| Range | 44.1% | 68.7% |
| Mean | 61.0% | 62.6% |
| Median | 61.7% | 62.6% |
| Interquartile 25% (IQ1) | 56.1% | 56.0% |
| Interquartile 75% (IQ3) | 66.3% | 66.5% |
| Interquartile Range (IQR) | 10.1% | 10.4% |
| Standard Deviation (Sample) | 8.9% | 12.8% |
| Standard Deviation (Population) | 8.8% | 12.7% |
Similar Demographics by College, Under 1 year
Demographics Similar to Immigrants from St. Vincent and the Grenadines by College, Under 1 year
In terms of college, under 1 year, the demographic groups most similar to Immigrants from St. Vincent and the Grenadines are Paiute (59.6%, a difference of 0.010%), Immigrants from Jamaica (59.7%, a difference of 0.11%), British West Indian (59.5%, a difference of 0.15%), Sioux (59.4%, a difference of 0.32%), and Black/African American (59.4%, a difference of 0.42%).
| Demographics | Rating | Rank | College, Under 1 year |
| Bahamians | 0.1 /100 | #277 | Tragic 60.3% |
| Yaqui | 0.1 /100 | #278 | Tragic 60.2% |
| Ute | 0.1 /100 | #279 | Tragic 60.2% |
| Crow | 0.1 /100 | #280 | Tragic 60.2% |
| Cherokee | 0.1 /100 | #281 | Tragic 60.1% |
| Belizeans | 0.1 /100 | #282 | Tragic 60.1% |
| Immigrants | Jamaica | 0.0 /100 | #283 | Tragic 59.7% |
| Immigrants | St. Vincent and the Grenadines | 0.0 /100 | #284 | Tragic 59.6% |
| Paiute | 0.0 /100 | #285 | Tragic 59.6% |
| British West Indians | 0.0 /100 | #286 | Tragic 59.5% |
| Sioux | 0.0 /100 | #287 | Tragic 59.4% |
| Blacks/African Americans | 0.0 /100 | #288 | Tragic 59.4% |
| Choctaw | 0.0 /100 | #289 | Tragic 59.3% |
| Ecuadorians | 0.0 /100 | #290 | Tragic 59.3% |
| Creek | 0.0 /100 | #291 | Tragic 59.3% |
Demographics Similar to Immigrants from Colombia by College, Under 1 year
In terms of college, under 1 year, the demographic groups most similar to Immigrants from Colombia are Immigrants from Peru (63.1%, a difference of 0.020%), Immigrants from Ghana (63.1%, a difference of 0.090%), Subsaharan African (63.2%, a difference of 0.12%), Immigrants from Costa Rica (63.2%, a difference of 0.15%), and Samoan (63.0%, a difference of 0.20%).
| Demographics | Rating | Rank | College, Under 1 year |
| Immigrants | Fiji | 5.7 /100 | #219 | Tragic 63.4% |
| Portuguese | 5.6 /100 | #220 | Tragic 63.4% |
| Cree | 5.2 /100 | #221 | Tragic 63.3% |
| Immigrants | Senegal | 5.0 /100 | #222 | Tragic 63.3% |
| Immigrants | Costa Rica | 4.5 /100 | #223 | Tragic 63.2% |
| Sub-Saharan Africans | 4.4 /100 | #224 | Tragic 63.2% |
| Immigrants | Peru | 4.0 /100 | #225 | Tragic 63.1% |
| Immigrants | Colombia | 4.0 /100 | #226 | Tragic 63.1% |
| Immigrants | Ghana | 3.7 /100 | #227 | Tragic 63.1% |
| Samoans | 3.3 /100 | #228 | Tragic 63.0% |
| Liberians | 3.2 /100 | #229 | Tragic 63.0% |
| Immigrants | Nonimmigrants | 3.0 /100 | #230 | Tragic 62.9% |
| Immigrants | Western Africa | 2.4 /100 | #231 | Tragic 62.8% |
| Osage | 2.2 /100 | #232 | Tragic 62.7% |
| Iroquois | 2.0 /100 | #233 | Tragic 62.6% |