Haitian vs Immigrants from Colombia Master's Degree
COMPARE
Haitian
Immigrants from Colombia
Master's Degree
Master's Degree Comparison
Haitians
Immigrants from Colombia
12.1%
MASTER'S DEGREE
0.3/ 100
METRIC RATING
271st/ 347
METRIC RANK
14.9%
MASTER'S DEGREE
48.3/ 100
METRIC RATING
177th/ 347
METRIC RANK
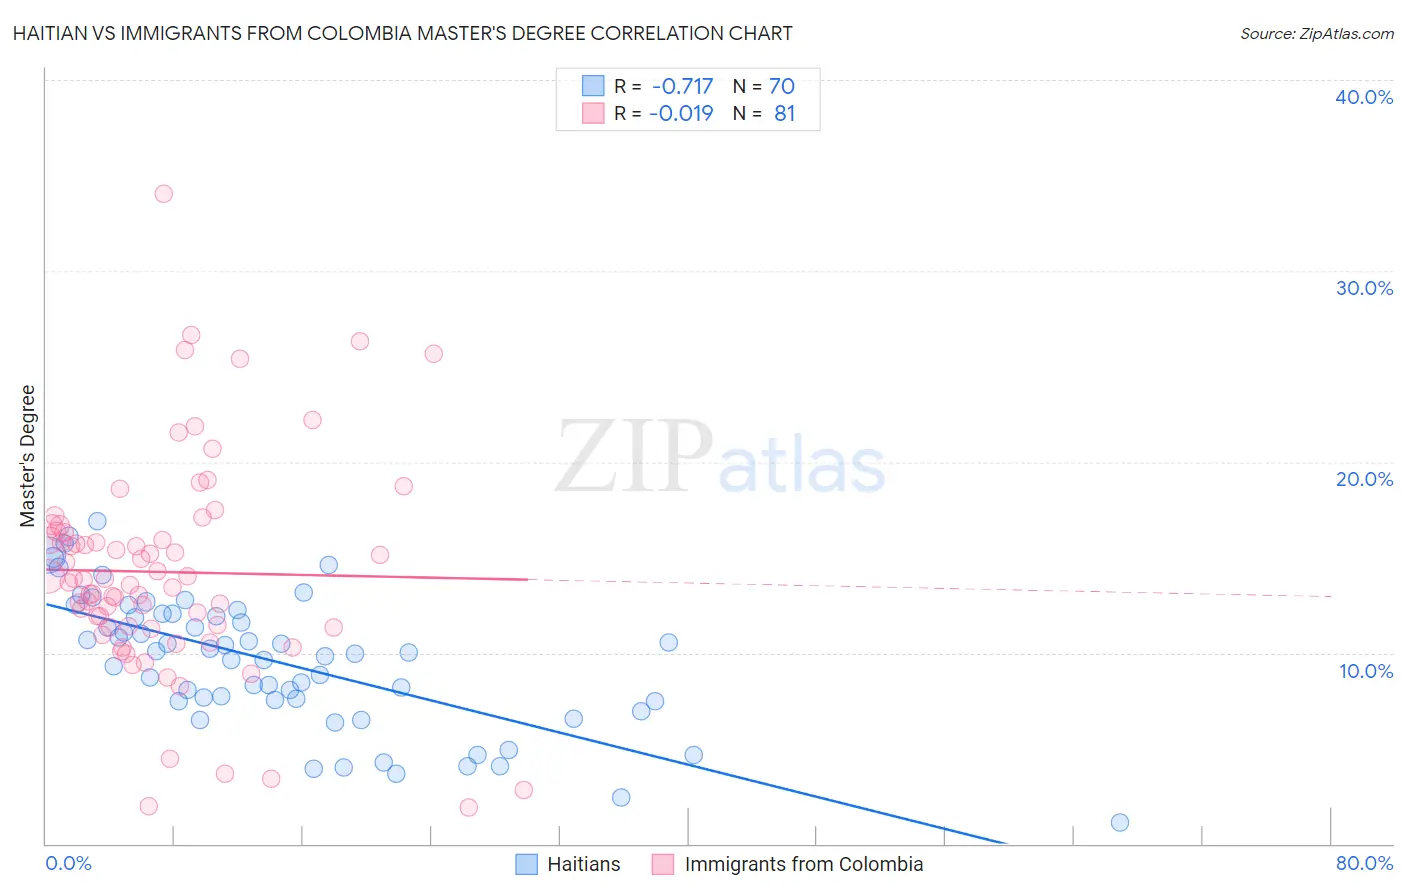
Haitian vs Immigrants from Colombia Master's Degree Correlation Chart
The statistical analysis conducted on geographies consisting of 287,849,817 people shows a strong negative correlation between the proportion of Haitians and percentage of population with at least master's degree education in the United States with a correlation coefficient (R) of -0.717 and weighted average of 12.1%. Similarly, the statistical analysis conducted on geographies consisting of 378,578,411 people shows no correlation between the proportion of Immigrants from Colombia and percentage of population with at least master's degree education in the United States with a correlation coefficient (R) of -0.019 and weighted average of 14.9%, a difference of 23.0%.
Master's Degree Correlation Summary
| Measurement | Haitian | Immigrants from Colombia |
| Minimum | 1.1% | 1.9% |
| Maximum | 16.9% | 34.0% |
| Range | 15.8% | 32.1% |
| Mean | 9.5% | 14.2% |
| Median | 10.0% | 13.8% |
| Interquartile 25% (IQ1) | 7.5% | 11.3% |
| Interquartile 75% (IQ3) | 12.0% | 16.3% |
| Interquartile Range (IQR) | 4.6% | 5.0% |
| Standard Deviation (Sample) | 3.5% | 5.6% |
| Standard Deviation (Population) | 3.5% | 5.6% |
Similar Demographics by Master's Degree
Demographics Similar to Haitians by Master's Degree
In terms of master's degree, the demographic groups most similar to Haitians are Comanche (12.1%, a difference of 0.060%), Blackfeet (12.1%, a difference of 0.15%), Cape Verdean (12.1%, a difference of 0.24%), Cuban (12.1%, a difference of 0.25%), and Black/African American (12.1%, a difference of 0.31%).
| Demographics | Rating | Rank | Master's Degree |
| Belizeans | 0.5 /100 | #264 | Tragic 12.4% |
| Immigrants | Fiji | 0.5 /100 | #265 | Tragic 12.4% |
| Bahamians | 0.5 /100 | #266 | Tragic 12.4% |
| Americans | 0.4 /100 | #267 | Tragic 12.3% |
| Native Hawaiians | 0.4 /100 | #268 | Tragic 12.3% |
| Central Americans | 0.3 /100 | #269 | Tragic 12.2% |
| Salvadorans | 0.3 /100 | #270 | Tragic 12.2% |
| Haitians | 0.3 /100 | #271 | Tragic 12.1% |
| Comanche | 0.3 /100 | #272 | Tragic 12.1% |
| Blackfeet | 0.3 /100 | #273 | Tragic 12.1% |
| Cape Verdeans | 0.3 /100 | #274 | Tragic 12.1% |
| Cubans | 0.3 /100 | #275 | Tragic 12.1% |
| Blacks/African Americans | 0.3 /100 | #276 | Tragic 12.1% |
| Immigrants | Caribbean | 0.3 /100 | #277 | Tragic 12.1% |
| Potawatomi | 0.3 /100 | #278 | Tragic 12.1% |
Demographics Similar to Immigrants from Colombia by Master's Degree
In terms of master's degree, the demographic groups most similar to Immigrants from Colombia are Nigerian (14.9%, a difference of 0.030%), Immigrants from Peru (14.9%, a difference of 0.17%), Slovak (14.9%, a difference of 0.21%), English (14.8%, a difference of 0.44%), and Costa Rican (15.0%, a difference of 0.53%).
| Demographics | Rating | Rank | Master's Degree |
| Irish | 56.3 /100 | #170 | Average 15.0% |
| Immigrants | Ghana | 53.6 /100 | #171 | Average 15.0% |
| Immigrants | Uruguay | 52.8 /100 | #172 | Average 15.0% |
| Costa Ricans | 52.5 /100 | #173 | Average 15.0% |
| Slovaks | 50.0 /100 | #174 | Average 14.9% |
| Immigrants | Peru | 49.6 /100 | #175 | Average 14.9% |
| Nigerians | 48.6 /100 | #176 | Average 14.9% |
| Immigrants | Colombia | 48.3 /100 | #177 | Average 14.9% |
| English | 45.0 /100 | #178 | Average 14.8% |
| Immigrants | Iraq | 41.3 /100 | #179 | Average 14.8% |
| Celtics | 41.3 /100 | #180 | Average 14.8% |
| Swiss | 41.1 /100 | #181 | Average 14.7% |
| Czechs | 40.4 /100 | #182 | Average 14.7% |
| Sri Lankans | 39.6 /100 | #183 | Fair 14.7% |
| Immigrants | Zaire | 39.5 /100 | #184 | Fair 14.7% |