Haitian vs Belizean 7th Grade
COMPARE
Haitian
Belizean
7th Grade
7th Grade Comparison
Haitians
Belizeans
94.7%
7TH GRADE
0.0/ 100
METRIC RATING
294th/ 347
METRIC RANK
93.5%
7TH GRADE
0.0/ 100
METRIC RATING
321st/ 347
METRIC RANK
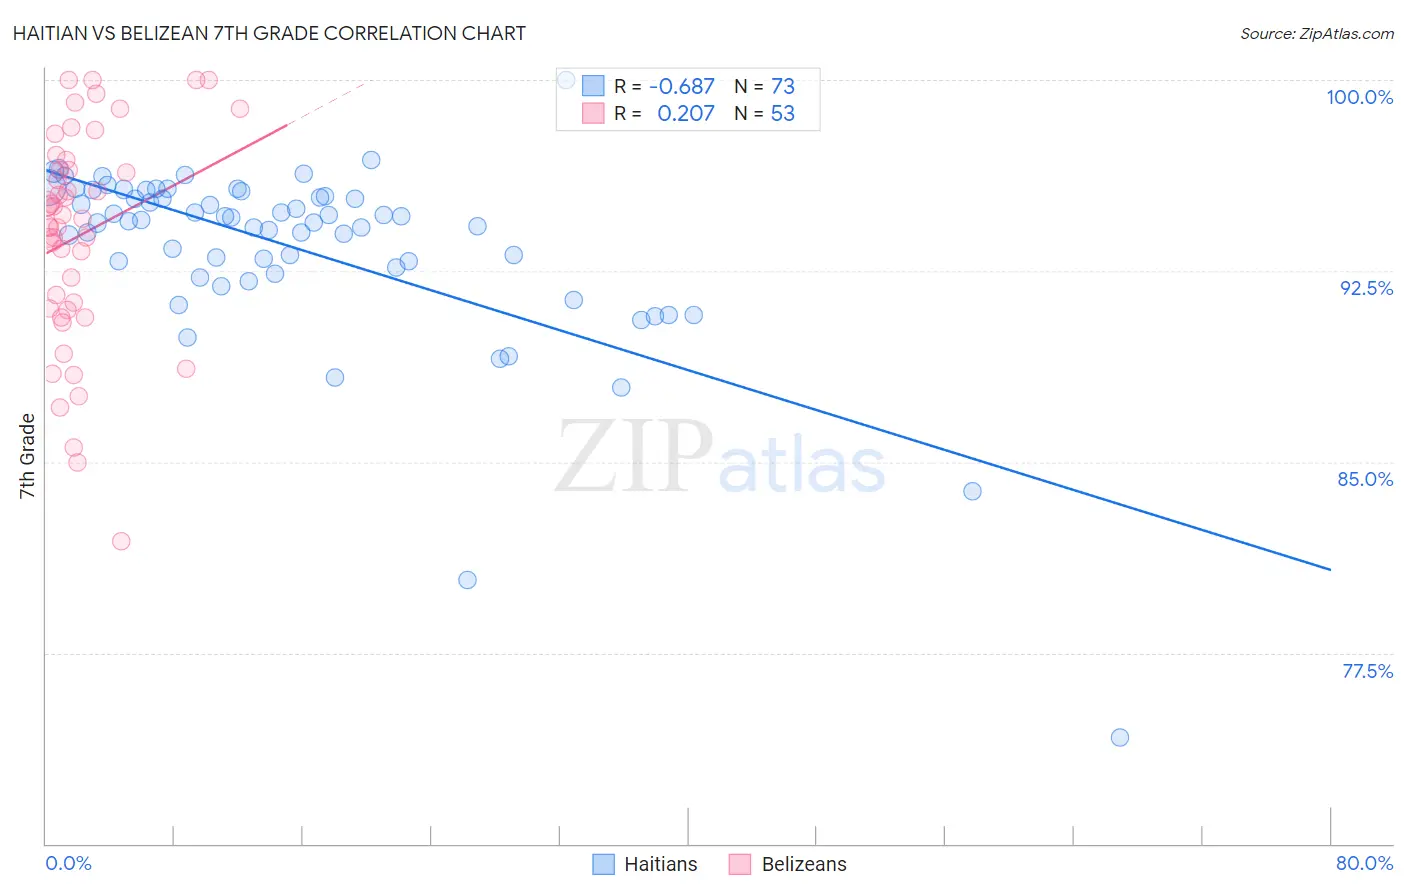
Haitian vs Belizean 7th Grade Correlation Chart
The statistical analysis conducted on geographies consisting of 287,965,116 people shows a significant negative correlation between the proportion of Haitians and percentage of population with at least 7th grade education in the United States with a correlation coefficient (R) of -0.687 and weighted average of 94.7%. Similarly, the statistical analysis conducted on geographies consisting of 144,138,333 people shows a weak positive correlation between the proportion of Belizeans and percentage of population with at least 7th grade education in the United States with a correlation coefficient (R) of 0.207 and weighted average of 93.5%, a difference of 1.2%.
7th Grade Correlation Summary
| Measurement | Haitian | Belizean |
| Minimum | 74.2% | 81.9% |
| Maximum | 100.0% | 100.0% |
| Range | 25.8% | 18.1% |
| Mean | 93.4% | 93.9% |
| Median | 94.5% | 94.6% |
| Interquartile 25% (IQ1) | 92.5% | 91.0% |
| Interquartile 75% (IQ3) | 95.5% | 96.7% |
| Interquartile Range (IQR) | 3.0% | 5.7% |
| Standard Deviation (Sample) | 3.7% | 4.2% |
| Standard Deviation (Population) | 3.7% | 4.2% |
Similar Demographics by 7th Grade
Demographics Similar to Haitians by 7th Grade
In terms of 7th grade, the demographic groups most similar to Haitians are Yaqui (94.6%, a difference of 0.030%), Cuban (94.6%, a difference of 0.040%), Fijian (94.7%, a difference of 0.080%), Immigrants from West Indies (94.8%, a difference of 0.10%), and Immigrants from Grenada (94.8%, a difference of 0.12%).
| Demographics | Rating | Rank | 7th Grade |
| Immigrants | Peru | 0.0 /100 | #287 | Tragic 94.9% |
| British West Indians | 0.0 /100 | #288 | Tragic 94.8% |
| Taiwanese | 0.0 /100 | #289 | Tragic 94.8% |
| Malaysians | 0.0 /100 | #290 | Tragic 94.8% |
| Immigrants | Grenada | 0.0 /100 | #291 | Tragic 94.8% |
| Immigrants | West Indies | 0.0 /100 | #292 | Tragic 94.8% |
| Fijians | 0.0 /100 | #293 | Tragic 94.7% |
| Haitians | 0.0 /100 | #294 | Tragic 94.7% |
| Yaqui | 0.0 /100 | #295 | Tragic 94.6% |
| Cubans | 0.0 /100 | #296 | Tragic 94.6% |
| Immigrants | South Eastern Asia | 0.0 /100 | #297 | Tragic 94.5% |
| Indonesians | 0.0 /100 | #298 | Tragic 94.5% |
| Bangladeshis | 0.0 /100 | #299 | Tragic 94.5% |
| Immigrants | Burma/Myanmar | 0.0 /100 | #300 | Tragic 94.5% |
| Immigrants | Dominica | 0.0 /100 | #301 | Tragic 94.5% |
Demographics Similar to Belizeans by 7th Grade
In terms of 7th grade, the demographic groups most similar to Belizeans are Immigrants from Fiji (93.5%, a difference of 0.040%), Nicaraguan (93.5%, a difference of 0.040%), Immigrants from Belize (93.4%, a difference of 0.15%), Dominican (93.3%, a difference of 0.16%), and Immigrants from Cambodia (93.7%, a difference of 0.21%).
| Demographics | Rating | Rank | 7th Grade |
| Japanese | 0.0 /100 | #314 | Tragic 94.0% |
| Vietnamese | 0.0 /100 | #315 | Tragic 93.9% |
| Immigrants | Vietnam | 0.0 /100 | #316 | Tragic 93.9% |
| Immigrants | Cuba | 0.0 /100 | #317 | Tragic 93.8% |
| Immigrants | Ecuador | 0.0 /100 | #318 | Tragic 93.7% |
| Immigrants | Cambodia | 0.0 /100 | #319 | Tragic 93.7% |
| Immigrants | Fiji | 0.0 /100 | #320 | Tragic 93.5% |
| Belizeans | 0.0 /100 | #321 | Tragic 93.5% |
| Nicaraguans | 0.0 /100 | #322 | Tragic 93.5% |
| Immigrants | Belize | 0.0 /100 | #323 | Tragic 93.4% |
| Dominicans | 0.0 /100 | #324 | Tragic 93.3% |
| Central American Indians | 0.0 /100 | #325 | Tragic 93.3% |
| Nepalese | 0.0 /100 | #326 | Tragic 93.2% |
| Immigrants | Cabo Verde | 0.0 /100 | #327 | Tragic 93.1% |
| Immigrants | Nicaragua | 0.0 /100 | #328 | Tragic 93.0% |