Haitian vs Immigrants from Italy High School Diploma
COMPARE
Haitian
Immigrants from Italy
High School Diploma
High School Diploma Comparison
Haitians
Immigrants from Italy
85.9%
HIGH SCHOOL DIPLOMA
0.0/ 100
METRIC RATING
291st/ 347
METRIC RANK
89.8%
HIGH SCHOOL DIPLOMA
87.4/ 100
METRIC RATING
131st/ 347
METRIC RANK
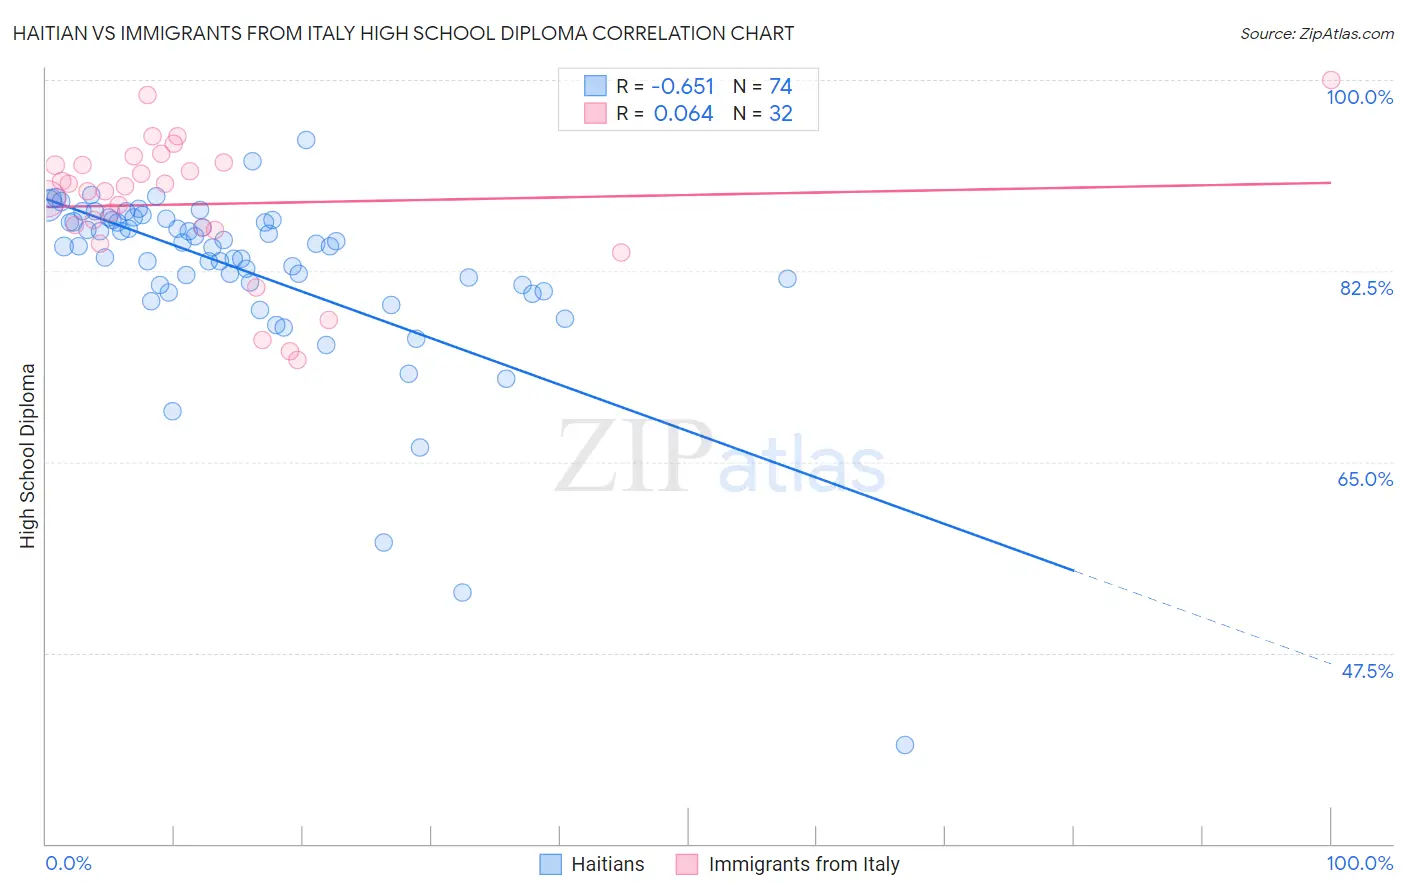
Haitian vs Immigrants from Italy High School Diploma Correlation Chart
The statistical analysis conducted on geographies consisting of 288,018,742 people shows a significant negative correlation between the proportion of Haitians and percentage of population with at least high school diploma education in the United States with a correlation coefficient (R) of -0.651 and weighted average of 85.9%. Similarly, the statistical analysis conducted on geographies consisting of 324,226,009 people shows a slight positive correlation between the proportion of Immigrants from Italy and percentage of population with at least high school diploma education in the United States with a correlation coefficient (R) of 0.064 and weighted average of 89.8%, a difference of 4.5%.
High School Diploma Correlation Summary
| Measurement | Haitian | Immigrants from Italy |
| Minimum | 39.0% | 74.4% |
| Maximum | 94.5% | 100.0% |
| Range | 55.5% | 25.6% |
| Mean | 82.5% | 88.6% |
| Median | 84.8% | 90.0% |
| Interquartile 25% (IQ1) | 81.2% | 86.4% |
| Interquartile 75% (IQ3) | 87.1% | 92.3% |
| Interquartile Range (IQR) | 5.9% | 6.0% |
| Standard Deviation (Sample) | 8.5% | 6.3% |
| Standard Deviation (Population) | 8.4% | 6.2% |
Similar Demographics by High School Diploma
Demographics Similar to Haitians by High School Diploma
In terms of high school diploma, the demographic groups most similar to Haitians are Japanese (85.9%, a difference of 0.0%), British West Indian (85.9%, a difference of 0.030%), Immigrants from Fiji (85.8%, a difference of 0.060%), Immigrants (85.8%, a difference of 0.080%), and Fijian (86.0%, a difference of 0.13%).
| Demographics | Rating | Rank | High School Diploma |
| Paiute | 0.0 /100 | #284 | Tragic 86.4% |
| Immigrants | West Indies | 0.0 /100 | #285 | Tragic 86.2% |
| Immigrants | St. Vincent and the Grenadines | 0.0 /100 | #286 | Tragic 86.2% |
| Ute | 0.0 /100 | #287 | Tragic 86.2% |
| Immigrants | Vietnam | 0.0 /100 | #288 | Tragic 86.2% |
| Yup'ik | 0.0 /100 | #289 | Tragic 86.1% |
| Fijians | 0.0 /100 | #290 | Tragic 86.0% |
| Haitians | 0.0 /100 | #291 | Tragic 85.9% |
| Japanese | 0.0 /100 | #292 | Tragic 85.9% |
| British West Indians | 0.0 /100 | #293 | Tragic 85.9% |
| Immigrants | Fiji | 0.0 /100 | #294 | Tragic 85.8% |
| Immigrants | Immigrants | 0.0 /100 | #295 | Tragic 85.8% |
| Immigrants | Cambodia | 0.0 /100 | #296 | Tragic 85.6% |
| Immigrants | Grenada | 0.0 /100 | #297 | Tragic 85.6% |
| Natives/Alaskans | 0.0 /100 | #298 | Tragic 85.6% |
Demographics Similar to Immigrants from Italy by High School Diploma
In terms of high school diploma, the demographic groups most similar to Immigrants from Italy are Immigrants from Bosnia and Herzegovina (89.8%, a difference of 0.0%), Albanian (89.8%, a difference of 0.010%), Immigrants from Jordan (89.8%, a difference of 0.010%), Immigrants from Ukraine (89.8%, a difference of 0.020%), and Basque (89.8%, a difference of 0.040%).
| Demographics | Rating | Rank | High School Diploma |
| Mongolians | 91.6 /100 | #124 | Exceptional 89.9% |
| Egyptians | 91.1 /100 | #125 | Exceptional 89.9% |
| Alaska Natives | 91.0 /100 | #126 | Exceptional 89.9% |
| Immigrants | Eastern Asia | 89.2 /100 | #127 | Excellent 89.9% |
| Puget Sound Salish | 89.1 /100 | #128 | Excellent 89.9% |
| Basques | 88.5 /100 | #129 | Excellent 89.8% |
| Immigrants | Ukraine | 87.9 /100 | #130 | Excellent 89.8% |
| Immigrants | Italy | 87.4 /100 | #131 | Excellent 89.8% |
| Immigrants | Bosnia and Herzegovina | 87.3 /100 | #132 | Excellent 89.8% |
| Albanians | 87.2 /100 | #133 | Excellent 89.8% |
| Immigrants | Jordan | 87.2 /100 | #134 | Excellent 89.8% |
| Chippewa | 85.6 /100 | #135 | Excellent 89.7% |
| Ugandans | 83.7 /100 | #136 | Excellent 89.7% |
| Arabs | 83.6 /100 | #137 | Excellent 89.7% |
| Assyrians/Chaldeans/Syriacs | 82.5 /100 | #138 | Excellent 89.7% |