Haitian vs Immigrants High School Diploma
COMPARE
Haitian
Immigrants
High School Diploma
High School Diploma Comparison
Haitians
Immigrants
85.9%
HIGH SCHOOL DIPLOMA
0.0/ 100
METRIC RATING
291st/ 347
METRIC RANK
85.8%
HIGH SCHOOL DIPLOMA
0.0/ 100
METRIC RATING
295th/ 347
METRIC RANK
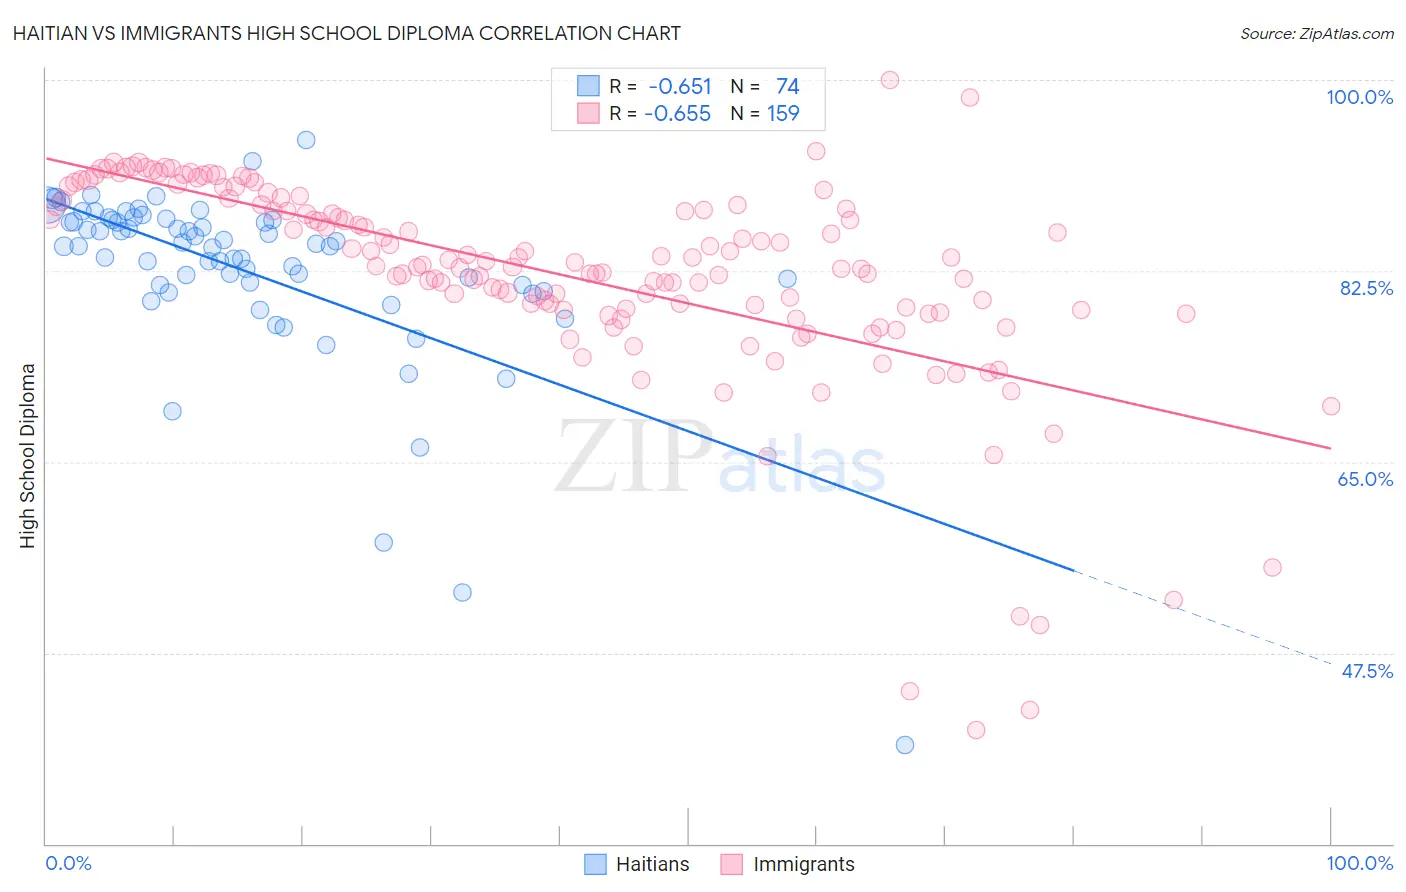
Haitian vs Immigrants High School Diploma Correlation Chart
The statistical analysis conducted on geographies consisting of 288,018,742 people shows a significant negative correlation between the proportion of Haitians and percentage of population with at least high school diploma education in the United States with a correlation coefficient (R) of -0.651 and weighted average of 85.9%. Similarly, the statistical analysis conducted on geographies consisting of 577,785,048 people shows a significant negative correlation between the proportion of Immigrants and percentage of population with at least high school diploma education in the United States with a correlation coefficient (R) of -0.655 and weighted average of 85.8%, a difference of 0.080%.
High School Diploma Correlation Summary
| Measurement | Haitian | Immigrants |
| Minimum | 39.0% | 40.4% |
| Maximum | 94.5% | 100.0% |
| Range | 55.5% | 59.6% |
| Mean | 82.5% | 82.1% |
| Median | 84.8% | 83.1% |
| Interquartile 25% (IQ1) | 81.2% | 79.0% |
| Interquartile 75% (IQ3) | 87.1% | 88.6% |
| Interquartile Range (IQR) | 5.9% | 9.6% |
| Standard Deviation (Sample) | 8.5% | 9.7% |
| Standard Deviation (Population) | 8.4% | 9.7% |
Demographics Similar to Haitians and Immigrants by High School Diploma
In terms of high school diploma, the demographic groups most similar to Haitians are Japanese (85.9%, a difference of 0.0%), British West Indian (85.9%, a difference of 0.030%), Immigrants from Fiji (85.8%, a difference of 0.060%), Fijian (86.0%, a difference of 0.13%), and Yup'ik (86.1%, a difference of 0.20%). Similarly, the demographic groups most similar to Immigrants are Immigrants from Fiji (85.8%, a difference of 0.020%), British West Indian (85.9%, a difference of 0.050%), Japanese (85.9%, a difference of 0.070%), Fijian (86.0%, a difference of 0.21%), and Immigrants from Cambodia (85.6%, a difference of 0.21%).
| Demographics | Rating | Rank | High School Diploma |
| Immigrants | Barbados | 0.0 /100 | #283 | Tragic 86.4% |
| Paiute | 0.0 /100 | #284 | Tragic 86.4% |
| Immigrants | West Indies | 0.0 /100 | #285 | Tragic 86.2% |
| Immigrants | St. Vincent and the Grenadines | 0.0 /100 | #286 | Tragic 86.2% |
| Ute | 0.0 /100 | #287 | Tragic 86.2% |
| Immigrants | Vietnam | 0.0 /100 | #288 | Tragic 86.2% |
| Yup'ik | 0.0 /100 | #289 | Tragic 86.1% |
| Fijians | 0.0 /100 | #290 | Tragic 86.0% |
| Haitians | 0.0 /100 | #291 | Tragic 85.9% |
| Japanese | 0.0 /100 | #292 | Tragic 85.9% |
| British West Indians | 0.0 /100 | #293 | Tragic 85.9% |
| Immigrants | Fiji | 0.0 /100 | #294 | Tragic 85.8% |
| Immigrants | Immigrants | 0.0 /100 | #295 | Tragic 85.8% |
| Immigrants | Cambodia | 0.0 /100 | #296 | Tragic 85.6% |
| Immigrants | Grenada | 0.0 /100 | #297 | Tragic 85.6% |
| Natives/Alaskans | 0.0 /100 | #298 | Tragic 85.6% |
| Guyanese | 0.0 /100 | #299 | Tragic 85.5% |
| Immigrants | Bangladesh | 0.0 /100 | #300 | Tragic 85.5% |
| Vietnamese | 0.0 /100 | #301 | Tragic 85.4% |
| Immigrants | Haiti | 0.0 /100 | #302 | Tragic 85.4% |
| Cubans | 0.0 /100 | #303 | Tragic 85.4% |