Haitian vs Immigrants from South Africa High School Diploma
COMPARE
Haitian
Immigrants from South Africa
High School Diploma
High School Diploma Comparison
Haitians
Immigrants from South Africa
85.9%
HIGH SCHOOL DIPLOMA
0.0/ 100
METRIC RATING
291st/ 347
METRIC RANK
91.0%
HIGH SCHOOL DIPLOMA
99.6/ 100
METRIC RATING
65th/ 347
METRIC RANK
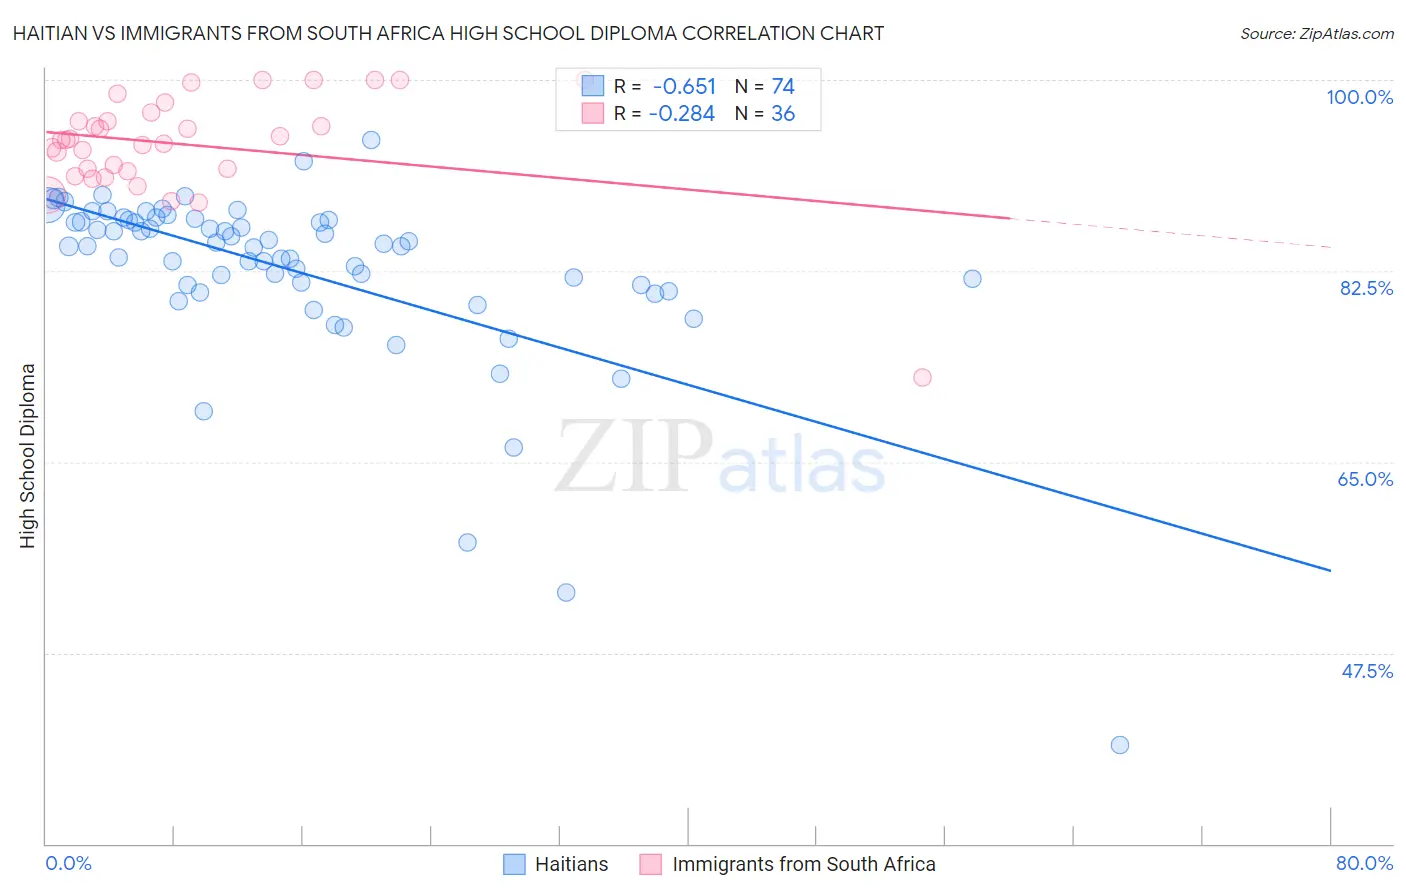
Haitian vs Immigrants from South Africa High School Diploma Correlation Chart
The statistical analysis conducted on geographies consisting of 288,018,742 people shows a significant negative correlation between the proportion of Haitians and percentage of population with at least high school diploma education in the United States with a correlation coefficient (R) of -0.651 and weighted average of 85.9%. Similarly, the statistical analysis conducted on geographies consisting of 233,321,693 people shows a weak negative correlation between the proportion of Immigrants from South Africa and percentage of population with at least high school diploma education in the United States with a correlation coefficient (R) of -0.284 and weighted average of 91.0%, a difference of 5.9%.
High School Diploma Correlation Summary
| Measurement | Haitian | Immigrants from South Africa |
| Minimum | 39.0% | 72.7% |
| Maximum | 94.5% | 100.0% |
| Range | 55.5% | 27.3% |
| Mean | 82.5% | 94.1% |
| Median | 84.8% | 94.5% |
| Interquartile 25% (IQ1) | 81.2% | 91.8% |
| Interquartile 75% (IQ3) | 87.1% | 96.6% |
| Interquartile Range (IQR) | 5.9% | 4.8% |
| Standard Deviation (Sample) | 8.5% | 5.0% |
| Standard Deviation (Population) | 8.4% | 4.9% |
Similar Demographics by High School Diploma
Demographics Similar to Haitians by High School Diploma
In terms of high school diploma, the demographic groups most similar to Haitians are Japanese (85.9%, a difference of 0.0%), British West Indian (85.9%, a difference of 0.030%), Immigrants from Fiji (85.8%, a difference of 0.060%), Immigrants (85.8%, a difference of 0.080%), and Fijian (86.0%, a difference of 0.13%).
| Demographics | Rating | Rank | High School Diploma |
| Paiute | 0.0 /100 | #284 | Tragic 86.4% |
| Immigrants | West Indies | 0.0 /100 | #285 | Tragic 86.2% |
| Immigrants | St. Vincent and the Grenadines | 0.0 /100 | #286 | Tragic 86.2% |
| Ute | 0.0 /100 | #287 | Tragic 86.2% |
| Immigrants | Vietnam | 0.0 /100 | #288 | Tragic 86.2% |
| Yup'ik | 0.0 /100 | #289 | Tragic 86.1% |
| Fijians | 0.0 /100 | #290 | Tragic 86.0% |
| Haitians | 0.0 /100 | #291 | Tragic 85.9% |
| Japanese | 0.0 /100 | #292 | Tragic 85.9% |
| British West Indians | 0.0 /100 | #293 | Tragic 85.9% |
| Immigrants | Fiji | 0.0 /100 | #294 | Tragic 85.8% |
| Immigrants | Immigrants | 0.0 /100 | #295 | Tragic 85.8% |
| Immigrants | Cambodia | 0.0 /100 | #296 | Tragic 85.6% |
| Immigrants | Grenada | 0.0 /100 | #297 | Tragic 85.6% |
| Natives/Alaskans | 0.0 /100 | #298 | Tragic 85.6% |
Demographics Similar to Immigrants from South Africa by High School Diploma
In terms of high school diploma, the demographic groups most similar to Immigrants from South Africa are Ukrainian (91.0%, a difference of 0.0%), Immigrants from Netherlands (91.0%, a difference of 0.010%), French (91.0%, a difference of 0.010%), Immigrants from Iran (90.9%, a difference of 0.030%), and Austrian (91.0%, a difference of 0.040%).
| Demographics | Rating | Rank | High School Diploma |
| Slavs | 99.7 /100 | #58 | Exceptional 91.0% |
| Immigrants | North America | 99.7 /100 | #59 | Exceptional 91.0% |
| Immigrants | Japan | 99.6 /100 | #60 | Exceptional 91.0% |
| Immigrants | Taiwan | 99.6 /100 | #61 | Exceptional 91.0% |
| Austrians | 99.6 /100 | #62 | Exceptional 91.0% |
| Immigrants | Netherlands | 99.6 /100 | #63 | Exceptional 91.0% |
| Ukrainians | 99.6 /100 | #64 | Exceptional 91.0% |
| Immigrants | South Africa | 99.6 /100 | #65 | Exceptional 91.0% |
| French | 99.5 /100 | #66 | Exceptional 91.0% |
| Immigrants | Iran | 99.5 /100 | #67 | Exceptional 90.9% |
| Czechoslovakians | 99.5 /100 | #68 | Exceptional 90.9% |
| French Canadians | 99.5 /100 | #69 | Exceptional 90.9% |
| Immigrants | Latvia | 99.5 /100 | #70 | Exceptional 90.9% |
| Alaskan Athabascans | 99.4 /100 | #71 | Exceptional 90.9% |
| Soviet Union | 99.4 /100 | #72 | Exceptional 90.9% |