Haitian vs Central American High School Diploma
COMPARE
Haitian
Central American
High School Diploma
High School Diploma Comparison
Haitians
Central Americans
85.9%
HIGH SCHOOL DIPLOMA
0.0/ 100
METRIC RATING
291st/ 347
METRIC RANK
82.5%
HIGH SCHOOL DIPLOMA
0.0/ 100
METRIC RATING
331st/ 347
METRIC RANK
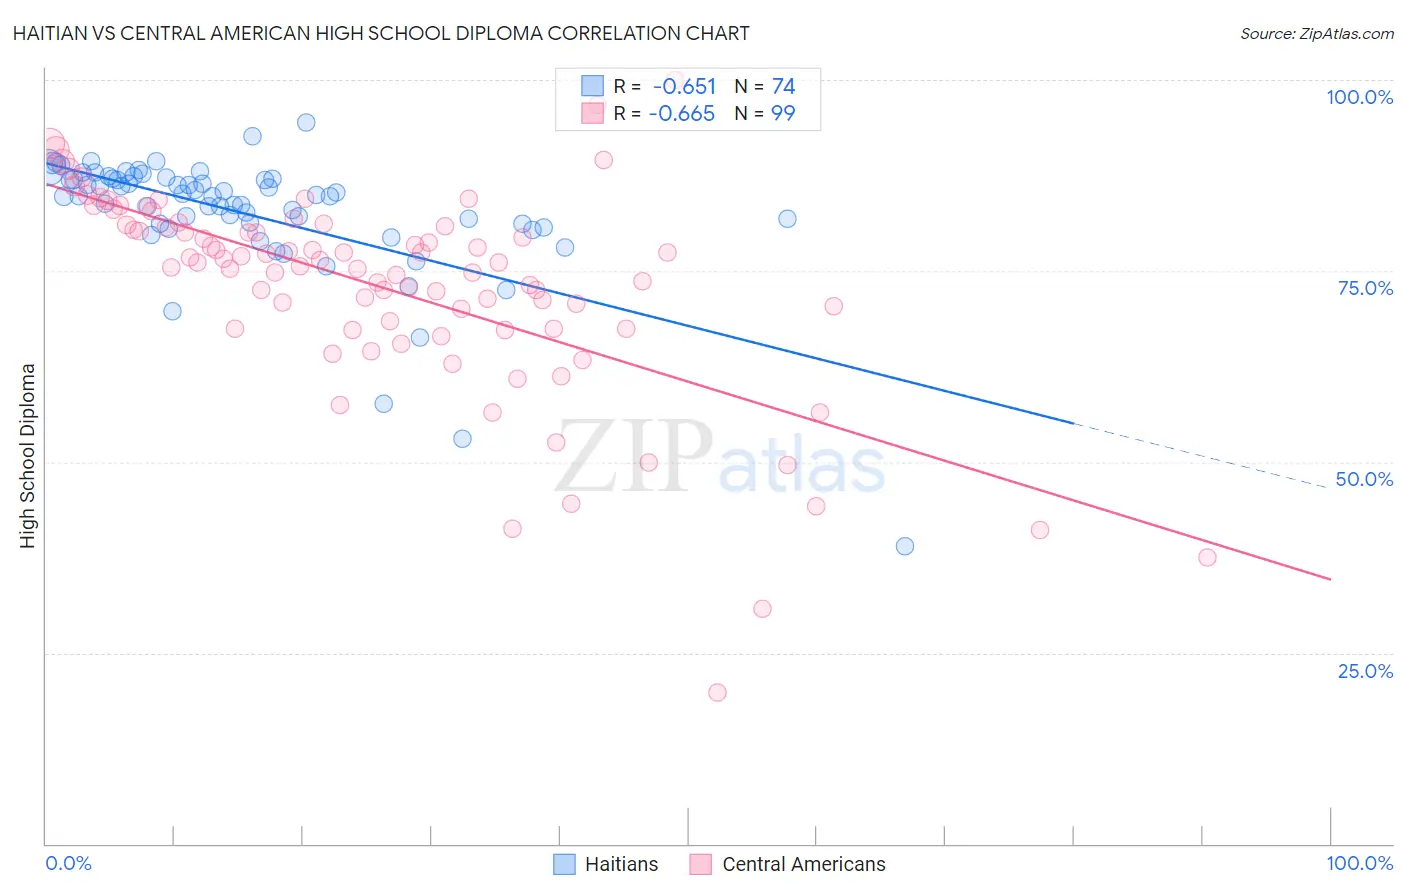
Haitian vs Central American High School Diploma Correlation Chart
The statistical analysis conducted on geographies consisting of 288,018,742 people shows a significant negative correlation between the proportion of Haitians and percentage of population with at least high school diploma education in the United States with a correlation coefficient (R) of -0.651 and weighted average of 85.9%. Similarly, the statistical analysis conducted on geographies consisting of 504,619,347 people shows a significant negative correlation between the proportion of Central Americans and percentage of population with at least high school diploma education in the United States with a correlation coefficient (R) of -0.665 and weighted average of 82.5%, a difference of 4.1%.
High School Diploma Correlation Summary
| Measurement | Haitian | Central American |
| Minimum | 39.0% | 19.8% |
| Maximum | 94.5% | 100.0% |
| Range | 55.5% | 80.2% |
| Mean | 82.5% | 72.8% |
| Median | 84.8% | 76.0% |
| Interquartile 25% (IQ1) | 81.2% | 67.5% |
| Interquartile 75% (IQ3) | 87.1% | 80.9% |
| Interquartile Range (IQR) | 5.9% | 13.4% |
| Standard Deviation (Sample) | 8.5% | 13.7% |
| Standard Deviation (Population) | 8.4% | 13.6% |
Similar Demographics by High School Diploma
Demographics Similar to Haitians by High School Diploma
In terms of high school diploma, the demographic groups most similar to Haitians are Japanese (85.9%, a difference of 0.0%), British West Indian (85.9%, a difference of 0.030%), Immigrants from Fiji (85.8%, a difference of 0.060%), Immigrants (85.8%, a difference of 0.080%), and Fijian (86.0%, a difference of 0.13%).
| Demographics | Rating | Rank | High School Diploma |
| Paiute | 0.0 /100 | #284 | Tragic 86.4% |
| Immigrants | West Indies | 0.0 /100 | #285 | Tragic 86.2% |
| Immigrants | St. Vincent and the Grenadines | 0.0 /100 | #286 | Tragic 86.2% |
| Ute | 0.0 /100 | #287 | Tragic 86.2% |
| Immigrants | Vietnam | 0.0 /100 | #288 | Tragic 86.2% |
| Yup'ik | 0.0 /100 | #289 | Tragic 86.1% |
| Fijians | 0.0 /100 | #290 | Tragic 86.0% |
| Haitians | 0.0 /100 | #291 | Tragic 85.9% |
| Japanese | 0.0 /100 | #292 | Tragic 85.9% |
| British West Indians | 0.0 /100 | #293 | Tragic 85.9% |
| Immigrants | Fiji | 0.0 /100 | #294 | Tragic 85.8% |
| Immigrants | Immigrants | 0.0 /100 | #295 | Tragic 85.8% |
| Immigrants | Cambodia | 0.0 /100 | #296 | Tragic 85.6% |
| Immigrants | Grenada | 0.0 /100 | #297 | Tragic 85.6% |
| Natives/Alaskans | 0.0 /100 | #298 | Tragic 85.6% |
Demographics Similar to Central Americans by High School Diploma
In terms of high school diploma, the demographic groups most similar to Central Americans are Immigrants from Honduras (82.5%, a difference of 0.10%), Immigrants from the Azores (82.8%, a difference of 0.31%), Hispanic or Latino (82.9%, a difference of 0.39%), Dominican (82.9%, a difference of 0.49%), and Immigrants from Latin America (82.1%, a difference of 0.49%).
| Demographics | Rating | Rank | High School Diploma |
| Immigrants | Cabo Verde | 0.0 /100 | #324 | Tragic 83.3% |
| Immigrants | Nicaragua | 0.0 /100 | #325 | Tragic 83.1% |
| Mexican American Indians | 0.0 /100 | #326 | Tragic 83.0% |
| Hondurans | 0.0 /100 | #327 | Tragic 83.0% |
| Dominicans | 0.0 /100 | #328 | Tragic 82.9% |
| Hispanics or Latinos | 0.0 /100 | #329 | Tragic 82.9% |
| Immigrants | Azores | 0.0 /100 | #330 | Tragic 82.8% |
| Central Americans | 0.0 /100 | #331 | Tragic 82.5% |
| Immigrants | Honduras | 0.0 /100 | #332 | Tragic 82.5% |
| Immigrants | Latin America | 0.0 /100 | #333 | Tragic 82.1% |
| Tohono O'odham | 0.0 /100 | #334 | Tragic 82.1% |
| Guatemalans | 0.0 /100 | #335 | Tragic 82.0% |
| Immigrants | Dominican Republic | 0.0 /100 | #336 | Tragic 82.0% |
| Immigrants | Yemen | 0.0 /100 | #337 | Tragic 81.8% |
| Salvadorans | 0.0 /100 | #338 | Tragic 81.7% |