Irish vs Immigrants from Zimbabwe Associate's Degree
COMPARE
Irish
Immigrants from Zimbabwe
Associate's Degree
Associate's Degree Comparison
Irish
Immigrants from Zimbabwe
46.5%
ASSOCIATE'S DEGREE
53.6/ 100
METRIC RATING
170th/ 347
METRIC RANK
50.5%
ASSOCIATE'S DEGREE
99.2/ 100
METRIC RATING
76th/ 347
METRIC RANK
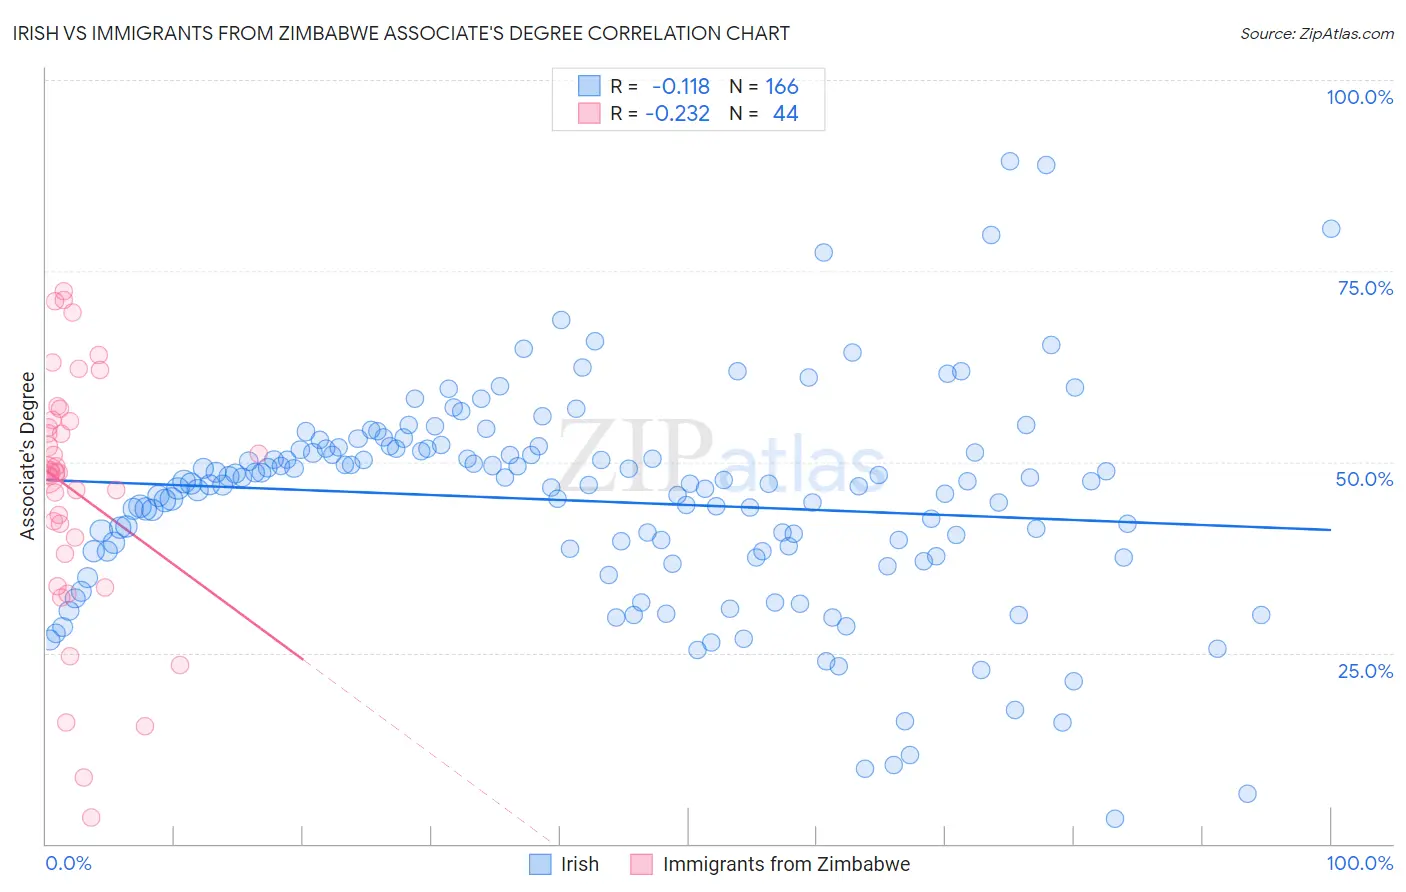
Irish vs Immigrants from Zimbabwe Associate's Degree Correlation Chart
The statistical analysis conducted on geographies consisting of 580,555,022 people shows a poor negative correlation between the proportion of Irish and percentage of population with at least associate's degree education in the United States with a correlation coefficient (R) of -0.118 and weighted average of 46.5%. Similarly, the statistical analysis conducted on geographies consisting of 117,809,864 people shows a weak negative correlation between the proportion of Immigrants from Zimbabwe and percentage of population with at least associate's degree education in the United States with a correlation coefficient (R) of -0.232 and weighted average of 50.5%, a difference of 8.6%.
Associate's Degree Correlation Summary
| Measurement | Irish | Immigrants from Zimbabwe |
| Minimum | 3.2% | 3.5% |
| Maximum | 89.4% | 72.3% |
| Range | 86.2% | 68.9% |
| Mean | 44.9% | 46.2% |
| Median | 47.1% | 48.6% |
| Interquartile 25% (IQ1) | 38.3% | 39.0% |
| Interquartile 75% (IQ3) | 51.7% | 55.5% |
| Interquartile Range (IQR) | 13.4% | 16.4% |
| Standard Deviation (Sample) | 13.9% | 16.2% |
| Standard Deviation (Population) | 13.9% | 16.0% |
Similar Demographics by Associate's Degree
Demographics Similar to Irish by Associate's Degree
In terms of associate's degree, the demographic groups most similar to Irish are Basque (46.5%, a difference of 0.060%), Uruguayan (46.5%, a difference of 0.13%), Immigrants from Somalia (46.5%, a difference of 0.14%), Peruvian (46.4%, a difference of 0.24%), and Immigrants from Iraq (46.4%, a difference of 0.25%).
| Demographics | Rating | Rank | Associate's Degree |
| Somalis | 62.5 /100 | #163 | Good 46.8% |
| Colombians | 62.4 /100 | #164 | Good 46.8% |
| Immigrants | South America | 59.9 /100 | #165 | Average 46.7% |
| Hungarians | 59.3 /100 | #166 | Average 46.7% |
| Immigrants | Sierra Leone | 59.2 /100 | #167 | Average 46.7% |
| Immigrants | Somalia | 55.5 /100 | #168 | Average 46.5% |
| Uruguayans | 55.4 /100 | #169 | Average 46.5% |
| Irish | 53.6 /100 | #170 | Average 46.5% |
| Basques | 52.8 /100 | #171 | Average 46.5% |
| Peruvians | 50.5 /100 | #172 | Average 46.4% |
| Immigrants | Iraq | 50.3 /100 | #173 | Average 46.4% |
| English | 50.0 /100 | #174 | Average 46.4% |
| Belgians | 48.9 /100 | #175 | Average 46.3% |
| Finns | 48.5 /100 | #176 | Average 46.3% |
| Slovaks | 48.4 /100 | #177 | Average 46.3% |
Demographics Similar to Immigrants from Zimbabwe by Associate's Degree
In terms of associate's degree, the demographic groups most similar to Immigrants from Zimbabwe are Immigrants from Lebanon (50.5%, a difference of 0.030%), Immigrants from Eastern Europe (50.5%, a difference of 0.080%), Ethiopian (50.4%, a difference of 0.090%), Armenian (50.4%, a difference of 0.12%), and Maltese (50.4%, a difference of 0.19%).
| Demographics | Rating | Rank | Associate's Degree |
| Egyptians | 99.5 /100 | #69 | Exceptional 50.9% |
| Immigrants | Argentina | 99.5 /100 | #70 | Exceptional 50.9% |
| Immigrants | Romania | 99.5 /100 | #71 | Exceptional 50.9% |
| Immigrants | Pakistan | 99.5 /100 | #72 | Exceptional 50.9% |
| Carpatho Rusyns | 99.3 /100 | #73 | Exceptional 50.6% |
| Lithuanians | 99.3 /100 | #74 | Exceptional 50.6% |
| Immigrants | Scotland | 99.3 /100 | #75 | Exceptional 50.6% |
| Immigrants | Zimbabwe | 99.2 /100 | #76 | Exceptional 50.5% |
| Immigrants | Lebanon | 99.1 /100 | #77 | Exceptional 50.5% |
| Immigrants | Eastern Europe | 99.1 /100 | #78 | Exceptional 50.5% |
| Ethiopians | 99.1 /100 | #79 | Exceptional 50.4% |
| Armenians | 99.1 /100 | #80 | Exceptional 50.4% |
| Maltese | 99.1 /100 | #81 | Exceptional 50.4% |
| Greeks | 98.9 /100 | #82 | Exceptional 50.3% |
| Immigrants | Uzbekistan | 98.9 /100 | #83 | Exceptional 50.3% |