Guyanese vs Immigrants from Trinidad and Tobago 9th Grade
COMPARE
Guyanese
Immigrants from Trinidad and Tobago
9th Grade
9th Grade Comparison
Guyanese
Immigrants from Trinidad and Tobago
92.7%
9TH GRADE
0.0/ 100
METRIC RATING
303rd/ 347
METRIC RANK
93.6%
9TH GRADE
0.1/ 100
METRIC RATING
281st/ 347
METRIC RANK
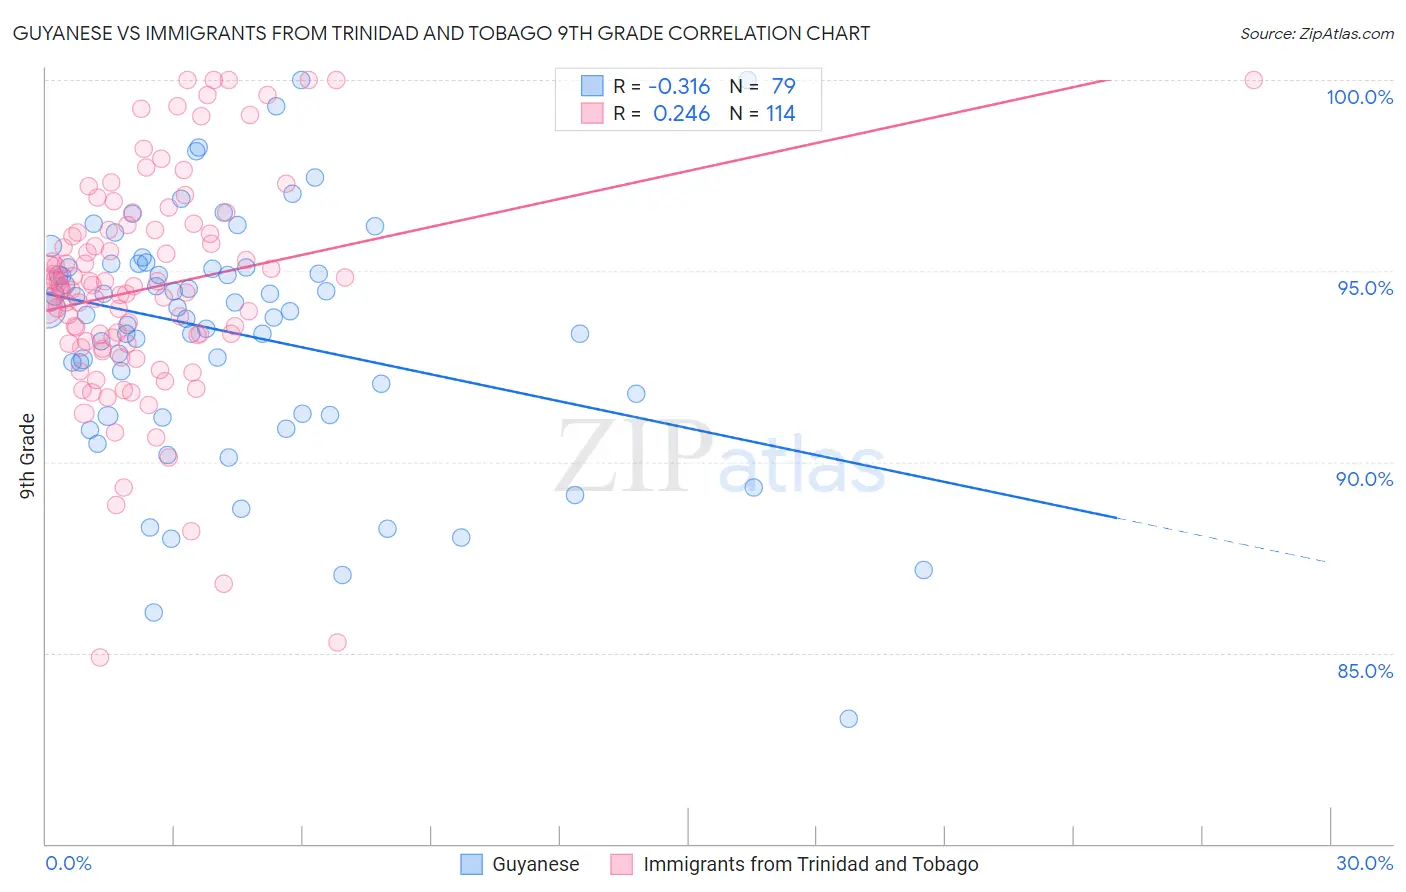
Guyanese vs Immigrants from Trinidad and Tobago 9th Grade Correlation Chart
The statistical analysis conducted on geographies consisting of 176,937,226 people shows a mild negative correlation between the proportion of Guyanese and percentage of population with at least 9th grade education in the United States with a correlation coefficient (R) of -0.316 and weighted average of 92.7%. Similarly, the statistical analysis conducted on geographies consisting of 223,526,834 people shows a weak positive correlation between the proportion of Immigrants from Trinidad and Tobago and percentage of population with at least 9th grade education in the United States with a correlation coefficient (R) of 0.246 and weighted average of 93.6%, a difference of 0.99%.
9th Grade Correlation Summary
| Measurement | Guyanese | Immigrants from Trinidad and Tobago |
| Minimum | 83.3% | 84.9% |
| Maximum | 100.0% | 100.0% |
| Range | 16.7% | 15.1% |
| Mean | 93.4% | 94.5% |
| Median | 93.9% | 94.6% |
| Interquartile 25% (IQ1) | 91.2% | 93.1% |
| Interquartile 75% (IQ3) | 95.1% | 96.1% |
| Interquartile Range (IQR) | 3.9% | 3.0% |
| Standard Deviation (Sample) | 3.2% | 2.9% |
| Standard Deviation (Population) | 3.2% | 2.9% |
Similar Demographics by 9th Grade
Demographics Similar to Guyanese by 9th Grade
In terms of 9th grade, the demographic groups most similar to Guyanese are Immigrants from Dominica (92.7%, a difference of 0.020%), Tohono O'odham (92.6%, a difference of 0.020%), Japanese (92.6%, a difference of 0.040%), Immigrants from Vietnam (92.6%, a difference of 0.040%), and Immigrants from Haiti (92.7%, a difference of 0.10%).
| Demographics | Rating | Rank | 9th Grade |
| Indonesians | 0.0 /100 | #296 | Tragic 93.1% |
| Fijians | 0.0 /100 | #297 | Tragic 93.1% |
| Haitians | 0.0 /100 | #298 | Tragic 93.1% |
| Immigrants | Grenada | 0.0 /100 | #299 | Tragic 93.0% |
| Yaqui | 0.0 /100 | #300 | Tragic 92.9% |
| Immigrants | Haiti | 0.0 /100 | #301 | Tragic 92.7% |
| Immigrants | Dominica | 0.0 /100 | #302 | Tragic 92.7% |
| Guyanese | 0.0 /100 | #303 | Tragic 92.7% |
| Tohono O'odham | 0.0 /100 | #304 | Tragic 92.6% |
| Japanese | 0.0 /100 | #305 | Tragic 92.6% |
| Immigrants | Vietnam | 0.0 /100 | #306 | Tragic 92.6% |
| Immigrants | Immigrants | 0.0 /100 | #307 | Tragic 92.5% |
| Immigrants | Guyana | 0.0 /100 | #308 | Tragic 92.5% |
| Immigrants | Bangladesh | 0.0 /100 | #309 | Tragic 92.4% |
| Immigrants | Cambodia | 0.0 /100 | #310 | Tragic 92.4% |
Demographics Similar to Immigrants from Trinidad and Tobago by 9th Grade
In terms of 9th grade, the demographic groups most similar to Immigrants from Trinidad and Tobago are Taiwanese (93.6%, a difference of 0.040%), Malaysian (93.5%, a difference of 0.050%), Barbadian (93.5%, a difference of 0.070%), Trinidadian and Tobagonian (93.7%, a difference of 0.12%), and Bangladeshi (93.4%, a difference of 0.14%).
| Demographics | Rating | Rank | 9th Grade |
| Peruvians | 0.2 /100 | #274 | Tragic 93.8% |
| Immigrants | Colombia | 0.2 /100 | #275 | Tragic 93.8% |
| West Indians | 0.2 /100 | #276 | Tragic 93.7% |
| Immigrants | Philippines | 0.1 /100 | #277 | Tragic 93.7% |
| Immigrants | Eritrea | 0.1 /100 | #278 | Tragic 93.7% |
| Trinidadians and Tobagonians | 0.1 /100 | #279 | Tragic 93.7% |
| Taiwanese | 0.1 /100 | #280 | Tragic 93.6% |
| Immigrants | Trinidad and Tobago | 0.1 /100 | #281 | Tragic 93.6% |
| Malaysians | 0.0 /100 | #282 | Tragic 93.5% |
| Barbadians | 0.0 /100 | #283 | Tragic 93.5% |
| Bangladeshis | 0.0 /100 | #284 | Tragic 93.4% |
| Immigrants | Peru | 0.0 /100 | #285 | Tragic 93.4% |
| Immigrants | Barbados | 0.0 /100 | #286 | Tragic 93.4% |
| Immigrants | St. Vincent and the Grenadines | 0.0 /100 | #287 | Tragic 93.4% |
| Immigrants | South Eastern Asia | 0.0 /100 | #288 | Tragic 93.3% |