Guyanese vs Serbian 9th Grade
COMPARE
Guyanese
Serbian
9th Grade
9th Grade Comparison
Guyanese
Serbians
92.7%
9TH GRADE
0.0/ 100
METRIC RATING
303rd/ 347
METRIC RANK
96.0%
9TH GRADE
99.9/ 100
METRIC RATING
52nd/ 347
METRIC RANK
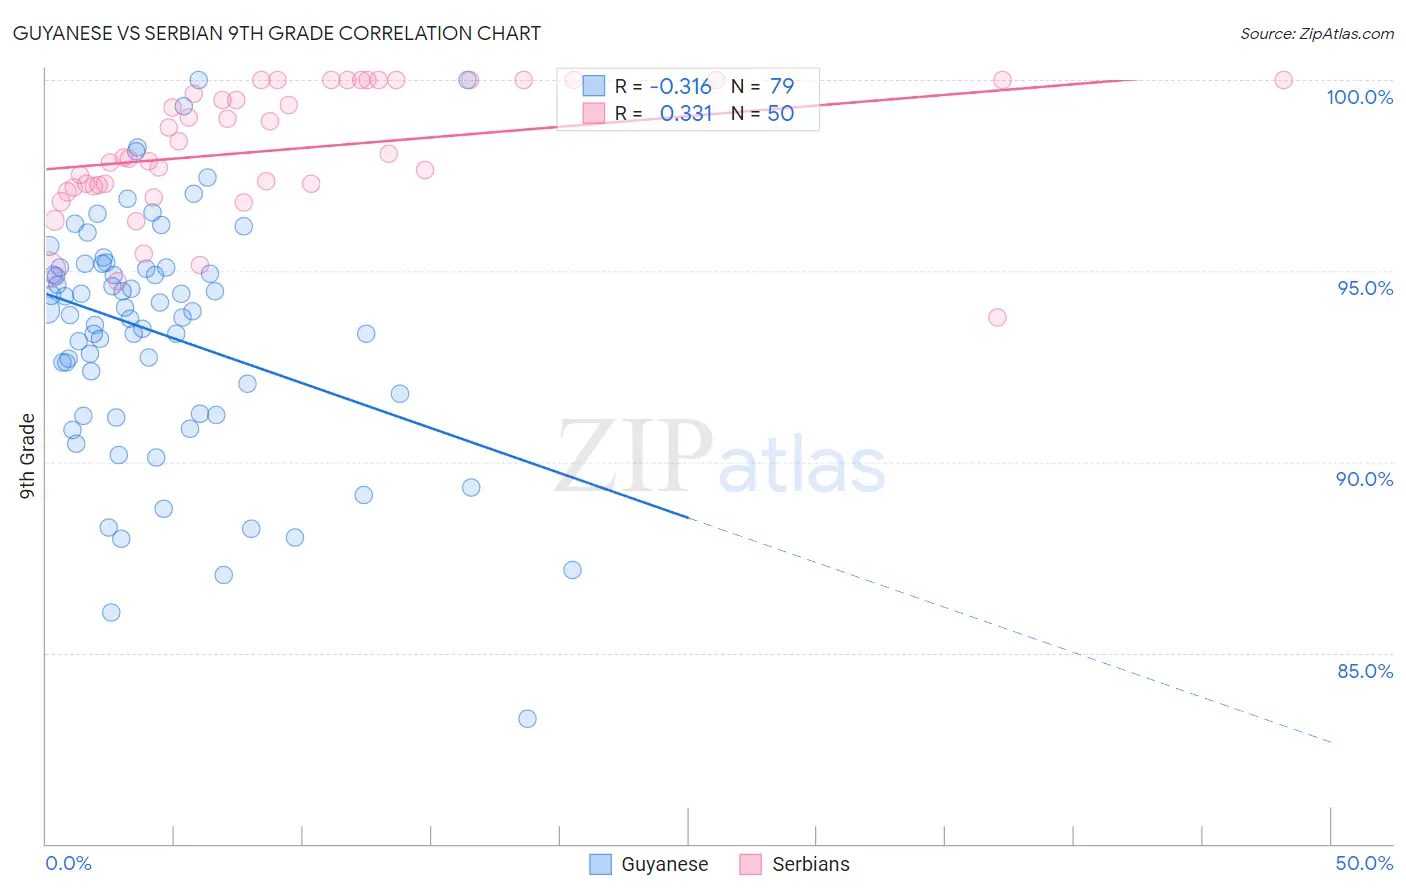
Guyanese vs Serbian 9th Grade Correlation Chart
The statistical analysis conducted on geographies consisting of 176,937,226 people shows a mild negative correlation between the proportion of Guyanese and percentage of population with at least 9th grade education in the United States with a correlation coefficient (R) of -0.316 and weighted average of 92.7%. Similarly, the statistical analysis conducted on geographies consisting of 267,641,806 people shows a mild positive correlation between the proportion of Serbians and percentage of population with at least 9th grade education in the United States with a correlation coefficient (R) of 0.331 and weighted average of 96.0%, a difference of 3.6%.
9th Grade Correlation Summary
| Measurement | Guyanese | Serbian |
| Minimum | 83.3% | 93.8% |
| Maximum | 100.0% | 100.0% |
| Range | 16.7% | 6.2% |
| Mean | 93.4% | 98.2% |
| Median | 93.9% | 98.0% |
| Interquartile 25% (IQ1) | 91.2% | 97.2% |
| Interquartile 75% (IQ3) | 95.1% | 100.0% |
| Interquartile Range (IQR) | 3.9% | 2.8% |
| Standard Deviation (Sample) | 3.2% | 1.7% |
| Standard Deviation (Population) | 3.2% | 1.6% |
Similar Demographics by 9th Grade
Demographics Similar to Guyanese by 9th Grade
In terms of 9th grade, the demographic groups most similar to Guyanese are Immigrants from Dominica (92.7%, a difference of 0.020%), Tohono O'odham (92.6%, a difference of 0.020%), Japanese (92.6%, a difference of 0.040%), Immigrants from Vietnam (92.6%, a difference of 0.040%), and Immigrants from Haiti (92.7%, a difference of 0.10%).
| Demographics | Rating | Rank | 9th Grade |
| Indonesians | 0.0 /100 | #296 | Tragic 93.1% |
| Fijians | 0.0 /100 | #297 | Tragic 93.1% |
| Haitians | 0.0 /100 | #298 | Tragic 93.1% |
| Immigrants | Grenada | 0.0 /100 | #299 | Tragic 93.0% |
| Yaqui | 0.0 /100 | #300 | Tragic 92.9% |
| Immigrants | Haiti | 0.0 /100 | #301 | Tragic 92.7% |
| Immigrants | Dominica | 0.0 /100 | #302 | Tragic 92.7% |
| Guyanese | 0.0 /100 | #303 | Tragic 92.7% |
| Tohono O'odham | 0.0 /100 | #304 | Tragic 92.6% |
| Japanese | 0.0 /100 | #305 | Tragic 92.6% |
| Immigrants | Vietnam | 0.0 /100 | #306 | Tragic 92.6% |
| Immigrants | Immigrants | 0.0 /100 | #307 | Tragic 92.5% |
| Immigrants | Guyana | 0.0 /100 | #308 | Tragic 92.5% |
| Immigrants | Bangladesh | 0.0 /100 | #309 | Tragic 92.4% |
| Immigrants | Cambodia | 0.0 /100 | #310 | Tragic 92.4% |
Demographics Similar to Serbians by 9th Grade
In terms of 9th grade, the demographic groups most similar to Serbians are Immigrants from Northern Europe (96.0%, a difference of 0.0%), Austrian (96.0%, a difference of 0.010%), Celtic (96.0%, a difference of 0.020%), Immigrants from Canada (96.0%, a difference of 0.020%), and Greek (96.0%, a difference of 0.030%).
| Demographics | Rating | Rank | 9th Grade |
| Crow | 99.9 /100 | #45 | Exceptional 96.1% |
| Immigrants | India | 99.9 /100 | #46 | Exceptional 96.1% |
| Russians | 99.9 /100 | #47 | Exceptional 96.0% |
| Australians | 99.9 /100 | #48 | Exceptional 96.0% |
| Greeks | 99.9 /100 | #49 | Exceptional 96.0% |
| Celtics | 99.9 /100 | #50 | Exceptional 96.0% |
| Immigrants | Northern Europe | 99.9 /100 | #51 | Exceptional 96.0% |
| Serbians | 99.9 /100 | #52 | Exceptional 96.0% |
| Austrians | 99.8 /100 | #53 | Exceptional 96.0% |
| Immigrants | Canada | 99.8 /100 | #54 | Exceptional 96.0% |
| Immigrants | Austria | 99.8 /100 | #55 | Exceptional 96.0% |
| Immigrants | North America | 99.8 /100 | #56 | Exceptional 96.0% |
| Macedonians | 99.8 /100 | #57 | Exceptional 96.0% |
| Aleuts | 99.8 /100 | #58 | Exceptional 96.0% |
| New Zealanders | 99.8 /100 | #59 | Exceptional 95.9% |