Shoshone vs Immigrants from Trinidad and Tobago 9th Grade
COMPARE
Shoshone
Immigrants from Trinidad and Tobago
9th Grade
9th Grade Comparison
Shoshone
Immigrants from Trinidad and Tobago
95.4%
9TH GRADE
95.3/ 100
METRIC RATING
124th/ 347
METRIC RANK
93.6%
9TH GRADE
0.1/ 100
METRIC RATING
281st/ 347
METRIC RANK
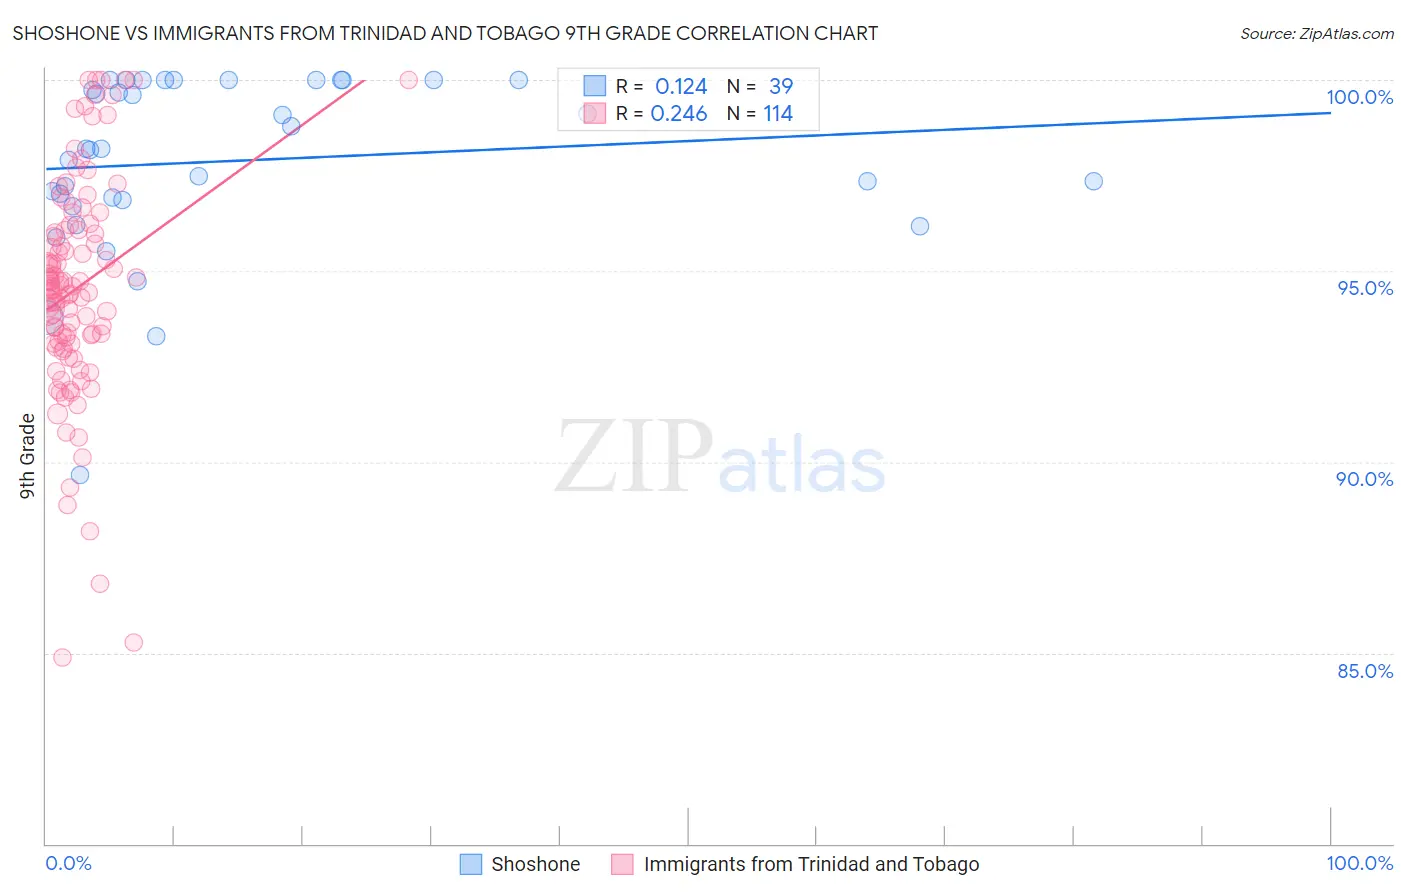
Shoshone vs Immigrants from Trinidad and Tobago 9th Grade Correlation Chart
The statistical analysis conducted on geographies consisting of 66,625,086 people shows a poor positive correlation between the proportion of Shoshone and percentage of population with at least 9th grade education in the United States with a correlation coefficient (R) of 0.124 and weighted average of 95.4%. Similarly, the statistical analysis conducted on geographies consisting of 223,526,834 people shows a weak positive correlation between the proportion of Immigrants from Trinidad and Tobago and percentage of population with at least 9th grade education in the United States with a correlation coefficient (R) of 0.246 and weighted average of 93.6%, a difference of 1.9%.
9th Grade Correlation Summary
| Measurement | Shoshone | Immigrants from Trinidad and Tobago |
| Minimum | 89.7% | 84.9% |
| Maximum | 100.0% | 100.0% |
| Range | 10.3% | 15.1% |
| Mean | 97.9% | 94.5% |
| Median | 98.2% | 94.6% |
| Interquartile 25% (IQ1) | 96.9% | 93.1% |
| Interquartile 75% (IQ3) | 100.0% | 96.1% |
| Interquartile Range (IQR) | 3.1% | 3.0% |
| Standard Deviation (Sample) | 2.3% | 2.9% |
| Standard Deviation (Population) | 2.3% | 2.9% |
Similar Demographics by 9th Grade
Demographics Similar to Shoshone by 9th Grade
In terms of 9th grade, the demographic groups most similar to Shoshone are Kiowa (95.4%, a difference of 0.0%), Cambodian (95.4%, a difference of 0.010%), Cree (95.4%, a difference of 0.010%), Immigrants from Kuwait (95.4%, a difference of 0.010%), and Immigrants from South Central Asia (95.4%, a difference of 0.010%).
| Demographics | Rating | Rank | 9th Grade |
| Immigrants | Romania | 95.6 /100 | #117 | Exceptional 95.4% |
| Immigrants | Turkey | 95.6 /100 | #118 | Exceptional 95.4% |
| Soviet Union | 95.6 /100 | #119 | Exceptional 95.4% |
| Cambodians | 95.6 /100 | #120 | Exceptional 95.4% |
| Cree | 95.5 /100 | #121 | Exceptional 95.4% |
| Immigrants | Kuwait | 95.5 /100 | #122 | Exceptional 95.4% |
| Kiowa | 95.3 /100 | #123 | Exceptional 95.4% |
| Shoshone | 95.3 /100 | #124 | Exceptional 95.4% |
| Immigrants | South Central Asia | 95.1 /100 | #125 | Exceptional 95.4% |
| Immigrants | Serbia | 94.4 /100 | #126 | Exceptional 95.4% |
| Palestinians | 94.3 /100 | #127 | Exceptional 95.4% |
| Immigrants | Hungary | 94.2 /100 | #128 | Exceptional 95.4% |
| Basques | 94.1 /100 | #129 | Exceptional 95.4% |
| Jordanians | 93.5 /100 | #130 | Exceptional 95.3% |
| Immigrants | North Macedonia | 92.3 /100 | #131 | Exceptional 95.3% |
Demographics Similar to Immigrants from Trinidad and Tobago by 9th Grade
In terms of 9th grade, the demographic groups most similar to Immigrants from Trinidad and Tobago are Taiwanese (93.6%, a difference of 0.040%), Malaysian (93.5%, a difference of 0.050%), Barbadian (93.5%, a difference of 0.070%), Trinidadian and Tobagonian (93.7%, a difference of 0.12%), and Bangladeshi (93.4%, a difference of 0.14%).
| Demographics | Rating | Rank | 9th Grade |
| Peruvians | 0.2 /100 | #274 | Tragic 93.8% |
| Immigrants | Colombia | 0.2 /100 | #275 | Tragic 93.8% |
| West Indians | 0.2 /100 | #276 | Tragic 93.7% |
| Immigrants | Philippines | 0.1 /100 | #277 | Tragic 93.7% |
| Immigrants | Eritrea | 0.1 /100 | #278 | Tragic 93.7% |
| Trinidadians and Tobagonians | 0.1 /100 | #279 | Tragic 93.7% |
| Taiwanese | 0.1 /100 | #280 | Tragic 93.6% |
| Immigrants | Trinidad and Tobago | 0.1 /100 | #281 | Tragic 93.6% |
| Malaysians | 0.0 /100 | #282 | Tragic 93.5% |
| Barbadians | 0.0 /100 | #283 | Tragic 93.5% |
| Bangladeshis | 0.0 /100 | #284 | Tragic 93.4% |
| Immigrants | Peru | 0.0 /100 | #285 | Tragic 93.4% |
| Immigrants | Barbados | 0.0 /100 | #286 | Tragic 93.4% |
| Immigrants | St. Vincent and the Grenadines | 0.0 /100 | #287 | Tragic 93.4% |
| Immigrants | South Eastern Asia | 0.0 /100 | #288 | Tragic 93.3% |