Guyanese vs Spanish American 9th Grade
COMPARE
Guyanese
Spanish American
9th Grade
9th Grade Comparison
Guyanese
Spanish Americans
92.7%
9TH GRADE
0.0/ 100
METRIC RATING
303rd/ 347
METRIC RANK
94.2%
9TH GRADE
2.6/ 100
METRIC RATING
241st/ 347
METRIC RANK
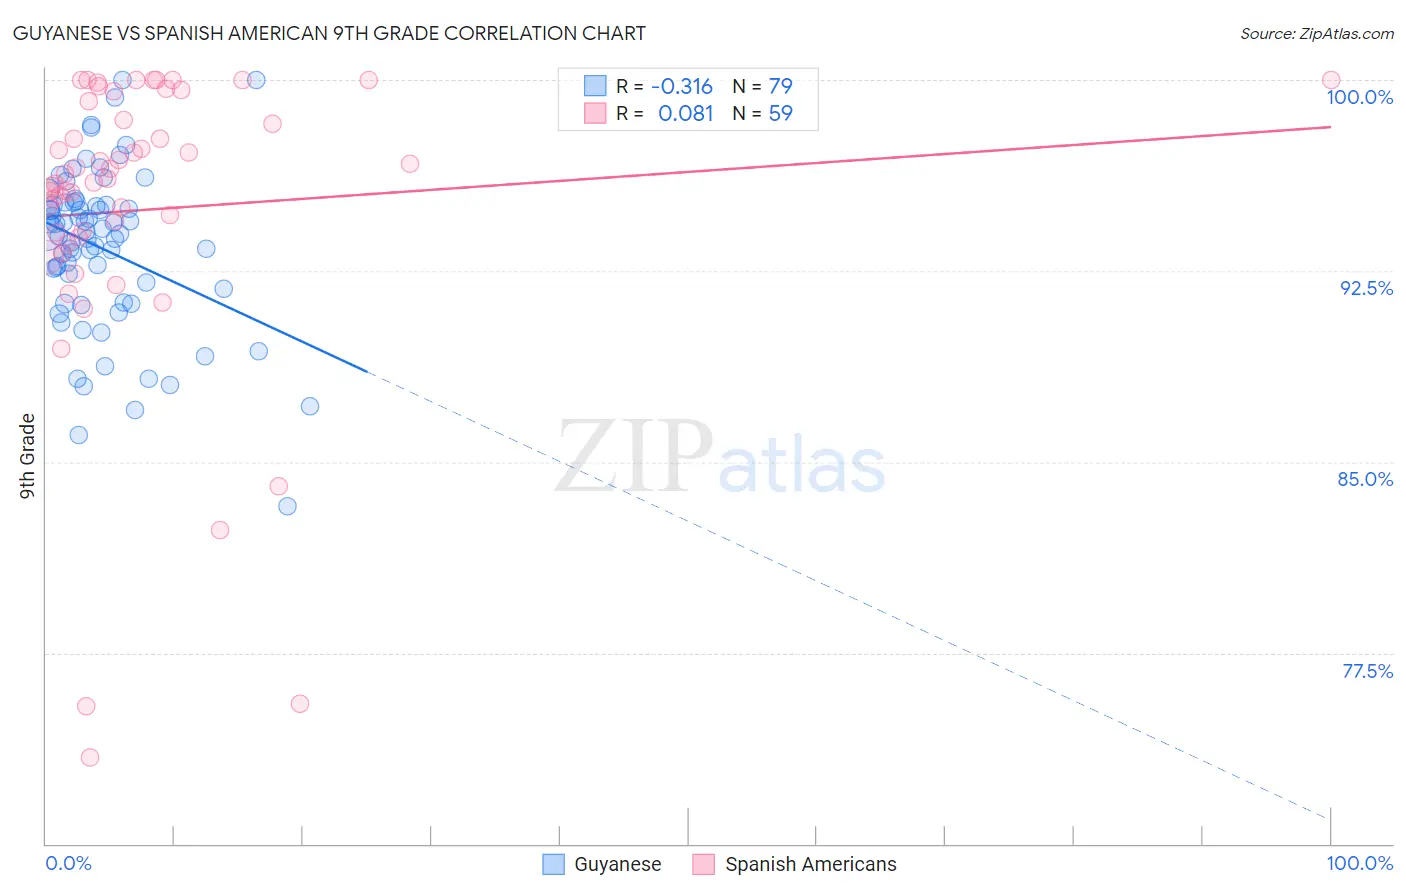
Guyanese vs Spanish American 9th Grade Correlation Chart
The statistical analysis conducted on geographies consisting of 176,937,226 people shows a mild negative correlation between the proportion of Guyanese and percentage of population with at least 9th grade education in the United States with a correlation coefficient (R) of -0.316 and weighted average of 92.7%. Similarly, the statistical analysis conducted on geographies consisting of 103,168,542 people shows a slight positive correlation between the proportion of Spanish Americans and percentage of population with at least 9th grade education in the United States with a correlation coefficient (R) of 0.081 and weighted average of 94.2%, a difference of 1.7%.
9th Grade Correlation Summary
| Measurement | Guyanese | Spanish American |
| Minimum | 83.3% | 73.4% |
| Maximum | 100.0% | 100.0% |
| Range | 16.7% | 26.6% |
| Mean | 93.4% | 94.9% |
| Median | 93.9% | 96.1% |
| Interquartile 25% (IQ1) | 91.2% | 93.8% |
| Interquartile 75% (IQ3) | 95.1% | 99.2% |
| Interquartile Range (IQR) | 3.9% | 5.3% |
| Standard Deviation (Sample) | 3.2% | 5.9% |
| Standard Deviation (Population) | 3.2% | 5.9% |
Similar Demographics by 9th Grade
Demographics Similar to Guyanese by 9th Grade
In terms of 9th grade, the demographic groups most similar to Guyanese are Immigrants from Dominica (92.7%, a difference of 0.020%), Tohono O'odham (92.6%, a difference of 0.020%), Japanese (92.6%, a difference of 0.040%), Immigrants from Vietnam (92.6%, a difference of 0.040%), and Immigrants from Haiti (92.7%, a difference of 0.10%).
| Demographics | Rating | Rank | 9th Grade |
| Indonesians | 0.0 /100 | #296 | Tragic 93.1% |
| Fijians | 0.0 /100 | #297 | Tragic 93.1% |
| Haitians | 0.0 /100 | #298 | Tragic 93.1% |
| Immigrants | Grenada | 0.0 /100 | #299 | Tragic 93.0% |
| Yaqui | 0.0 /100 | #300 | Tragic 92.9% |
| Immigrants | Haiti | 0.0 /100 | #301 | Tragic 92.7% |
| Immigrants | Dominica | 0.0 /100 | #302 | Tragic 92.7% |
| Guyanese | 0.0 /100 | #303 | Tragic 92.7% |
| Tohono O'odham | 0.0 /100 | #304 | Tragic 92.6% |
| Japanese | 0.0 /100 | #305 | Tragic 92.6% |
| Immigrants | Vietnam | 0.0 /100 | #306 | Tragic 92.6% |
| Immigrants | Immigrants | 0.0 /100 | #307 | Tragic 92.5% |
| Immigrants | Guyana | 0.0 /100 | #308 | Tragic 92.5% |
| Immigrants | Bangladesh | 0.0 /100 | #309 | Tragic 92.4% |
| Immigrants | Cambodia | 0.0 /100 | #310 | Tragic 92.4% |
Demographics Similar to Spanish Americans by 9th Grade
In terms of 9th grade, the demographic groups most similar to Spanish Americans are Immigrants from Ethiopia (94.3%, a difference of 0.0%), South American Indian (94.3%, a difference of 0.010%), Immigrants from China (94.3%, a difference of 0.010%), Somali (94.3%, a difference of 0.020%), and Korean (94.3%, a difference of 0.020%).
| Demographics | Rating | Rank | 9th Grade |
| Costa Ricans | 3.5 /100 | #234 | Tragic 94.3% |
| Bolivians | 3.3 /100 | #235 | Tragic 94.3% |
| Somalis | 2.9 /100 | #236 | Tragic 94.3% |
| Koreans | 2.9 /100 | #237 | Tragic 94.3% |
| South American Indians | 2.8 /100 | #238 | Tragic 94.3% |
| Immigrants | China | 2.8 /100 | #239 | Tragic 94.3% |
| Immigrants | Ethiopia | 2.7 /100 | #240 | Tragic 94.3% |
| Spanish Americans | 2.6 /100 | #241 | Tragic 94.2% |
| Immigrants | Middle Africa | 2.2 /100 | #242 | Tragic 94.2% |
| Immigrants | Cameroon | 2.1 /100 | #243 | Tragic 94.2% |
| Dutch West Indians | 2.0 /100 | #244 | Tragic 94.2% |
| Paiute | 1.9 /100 | #245 | Tragic 94.2% |
| Senegalese | 1.9 /100 | #246 | Tragic 94.2% |
| Afghans | 1.8 /100 | #247 | Tragic 94.2% |
| Immigrants | Somalia | 1.4 /100 | #248 | Tragic 94.1% |