Korean vs Immigrants from Trinidad and Tobago 9th Grade
COMPARE
Korean
Immigrants from Trinidad and Tobago
9th Grade
9th Grade Comparison
Koreans
Immigrants from Trinidad and Tobago
94.3%
9TH GRADE
2.9/ 100
METRIC RATING
237th/ 347
METRIC RANK
93.6%
9TH GRADE
0.1/ 100
METRIC RATING
281st/ 347
METRIC RANK
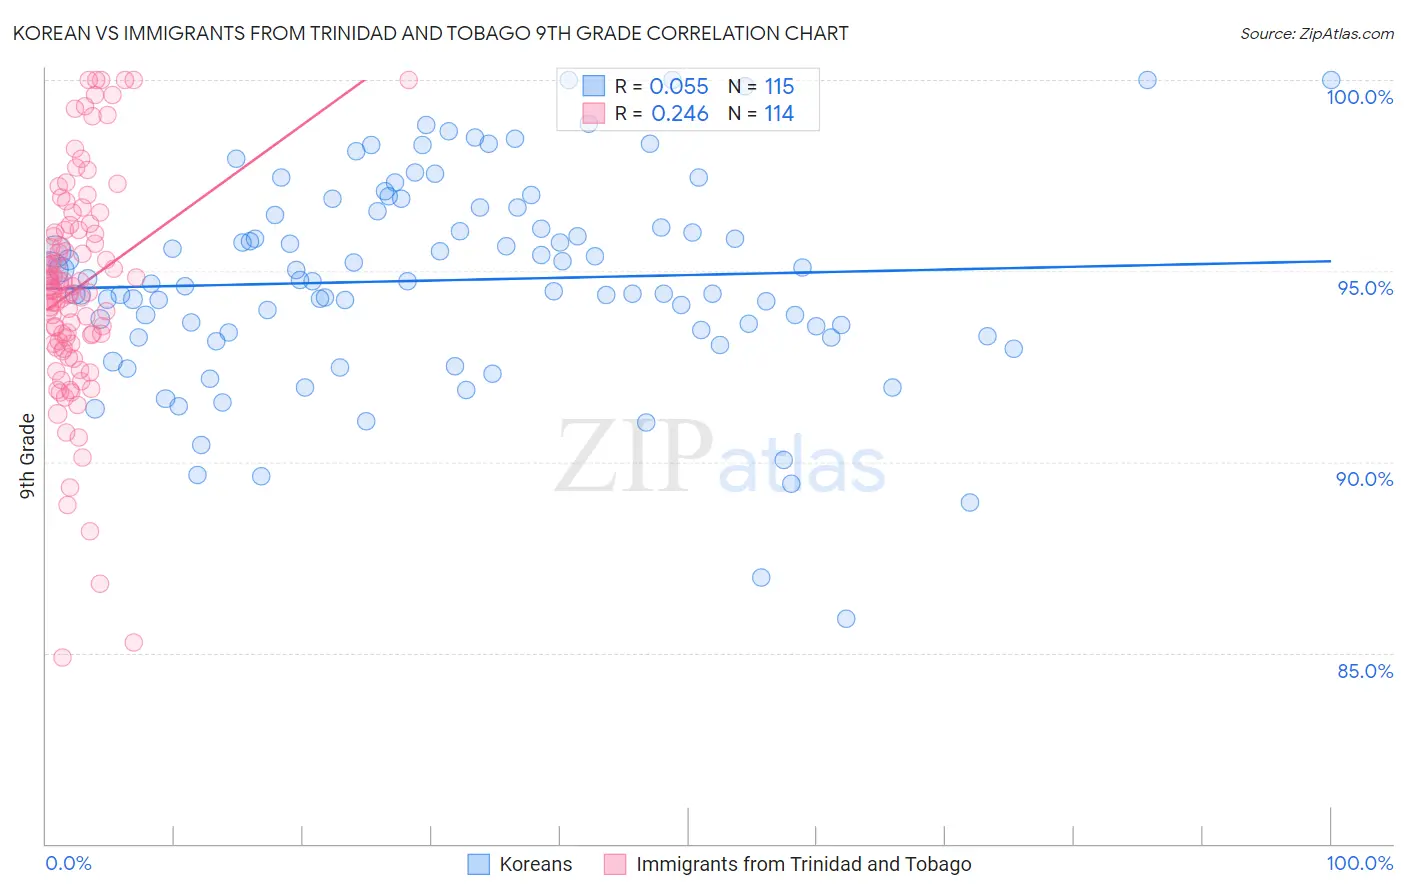
Korean vs Immigrants from Trinidad and Tobago 9th Grade Correlation Chart
The statistical analysis conducted on geographies consisting of 510,943,943 people shows a slight positive correlation between the proportion of Koreans and percentage of population with at least 9th grade education in the United States with a correlation coefficient (R) of 0.055 and weighted average of 94.3%. Similarly, the statistical analysis conducted on geographies consisting of 223,526,834 people shows a weak positive correlation between the proportion of Immigrants from Trinidad and Tobago and percentage of population with at least 9th grade education in the United States with a correlation coefficient (R) of 0.246 and weighted average of 93.6%, a difference of 0.74%.
9th Grade Correlation Summary
| Measurement | Korean | Immigrants from Trinidad and Tobago |
| Minimum | 85.9% | 84.9% |
| Maximum | 100.0% | 100.0% |
| Range | 14.1% | 15.1% |
| Mean | 94.8% | 94.5% |
| Median | 94.7% | 94.6% |
| Interquartile 25% (IQ1) | 93.3% | 93.1% |
| Interquartile 75% (IQ3) | 96.5% | 96.1% |
| Interquartile Range (IQR) | 3.3% | 3.0% |
| Standard Deviation (Sample) | 2.7% | 2.9% |
| Standard Deviation (Population) | 2.7% | 2.9% |
Similar Demographics by 9th Grade
Demographics Similar to Koreans by 9th Grade
In terms of 9th grade, the demographic groups most similar to Koreans are Somali (94.3%, a difference of 0.0%), South American Indian (94.3%, a difference of 0.0%), Immigrants from China (94.3%, a difference of 0.0%), Immigrants from Ethiopia (94.3%, a difference of 0.010%), and Spanish American (94.2%, a difference of 0.020%).
| Demographics | Rating | Rank | 9th Grade |
| Apache | 4.2 /100 | #230 | Tragic 94.3% |
| Immigrants | Panama | 4.0 /100 | #231 | Tragic 94.3% |
| Immigrants | Africa | 3.9 /100 | #232 | Tragic 94.3% |
| Nigerians | 3.7 /100 | #233 | Tragic 94.3% |
| Costa Ricans | 3.5 /100 | #234 | Tragic 94.3% |
| Bolivians | 3.3 /100 | #235 | Tragic 94.3% |
| Somalis | 2.9 /100 | #236 | Tragic 94.3% |
| Koreans | 2.9 /100 | #237 | Tragic 94.3% |
| South American Indians | 2.8 /100 | #238 | Tragic 94.3% |
| Immigrants | China | 2.8 /100 | #239 | Tragic 94.3% |
| Immigrants | Ethiopia | 2.7 /100 | #240 | Tragic 94.3% |
| Spanish Americans | 2.6 /100 | #241 | Tragic 94.2% |
| Immigrants | Middle Africa | 2.2 /100 | #242 | Tragic 94.2% |
| Immigrants | Cameroon | 2.1 /100 | #243 | Tragic 94.2% |
| Dutch West Indians | 2.0 /100 | #244 | Tragic 94.2% |
Demographics Similar to Immigrants from Trinidad and Tobago by 9th Grade
In terms of 9th grade, the demographic groups most similar to Immigrants from Trinidad and Tobago are Taiwanese (93.6%, a difference of 0.040%), Malaysian (93.5%, a difference of 0.050%), Barbadian (93.5%, a difference of 0.070%), Trinidadian and Tobagonian (93.7%, a difference of 0.12%), and Bangladeshi (93.4%, a difference of 0.14%).
| Demographics | Rating | Rank | 9th Grade |
| Peruvians | 0.2 /100 | #274 | Tragic 93.8% |
| Immigrants | Colombia | 0.2 /100 | #275 | Tragic 93.8% |
| West Indians | 0.2 /100 | #276 | Tragic 93.7% |
| Immigrants | Philippines | 0.1 /100 | #277 | Tragic 93.7% |
| Immigrants | Eritrea | 0.1 /100 | #278 | Tragic 93.7% |
| Trinidadians and Tobagonians | 0.1 /100 | #279 | Tragic 93.7% |
| Taiwanese | 0.1 /100 | #280 | Tragic 93.6% |
| Immigrants | Trinidad and Tobago | 0.1 /100 | #281 | Tragic 93.6% |
| Malaysians | 0.0 /100 | #282 | Tragic 93.5% |
| Barbadians | 0.0 /100 | #283 | Tragic 93.5% |
| Bangladeshis | 0.0 /100 | #284 | Tragic 93.4% |
| Immigrants | Peru | 0.0 /100 | #285 | Tragic 93.4% |
| Immigrants | Barbados | 0.0 /100 | #286 | Tragic 93.4% |
| Immigrants | St. Vincent and the Grenadines | 0.0 /100 | #287 | Tragic 93.4% |
| Immigrants | South Eastern Asia | 0.0 /100 | #288 | Tragic 93.3% |