Guyanese vs Immigrants from Australia 9th Grade
COMPARE
Guyanese
Immigrants from Australia
9th Grade
9th Grade Comparison
Guyanese
Immigrants from Australia
92.7%
9TH GRADE
0.0/ 100
METRIC RATING
303rd/ 347
METRIC RANK
95.8%
9TH GRADE
99.5/ 100
METRIC RATING
70th/ 347
METRIC RANK
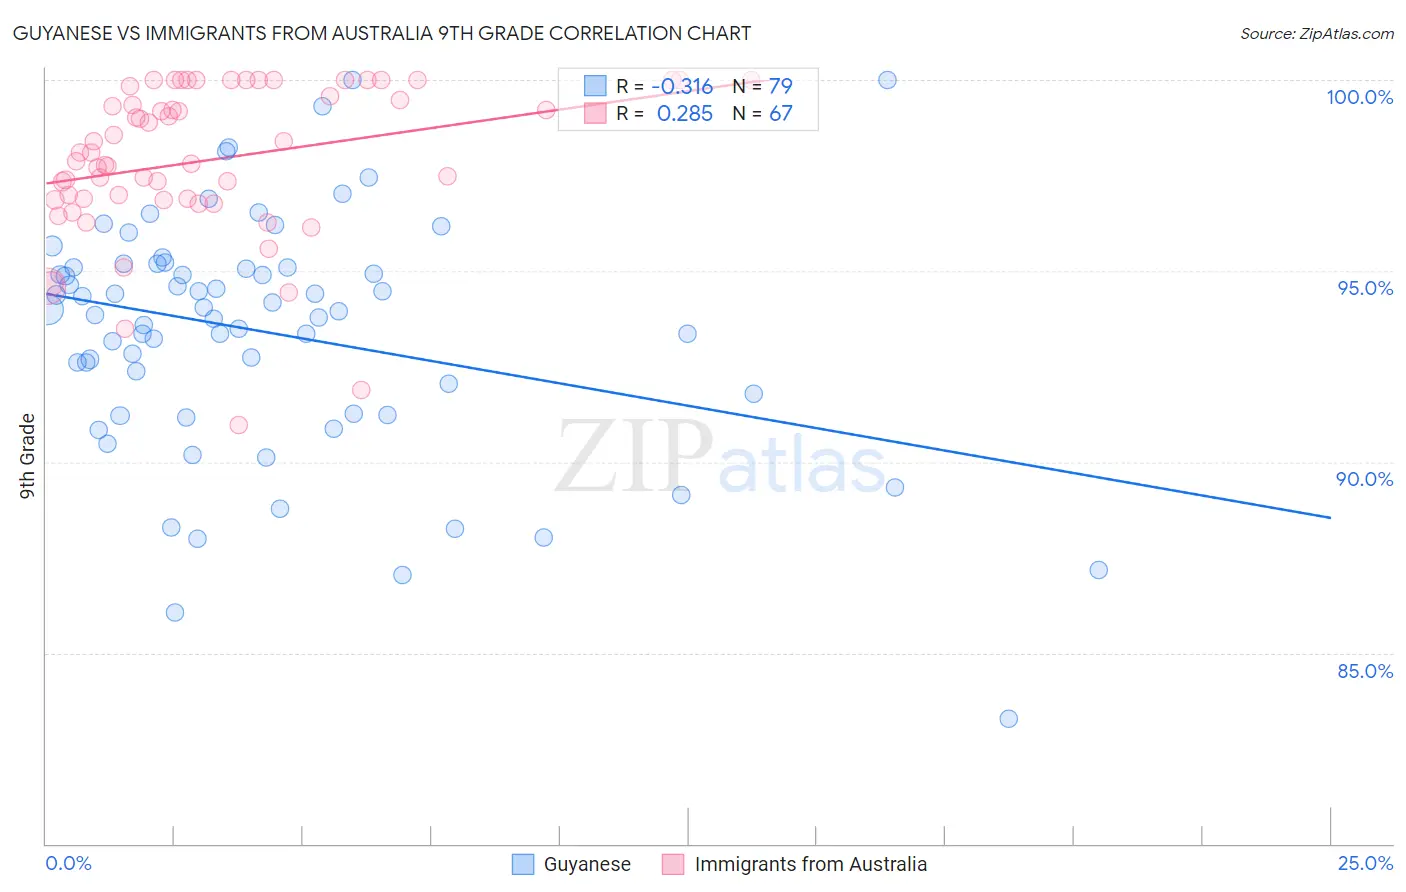
Guyanese vs Immigrants from Australia 9th Grade Correlation Chart
The statistical analysis conducted on geographies consisting of 176,937,226 people shows a mild negative correlation between the proportion of Guyanese and percentage of population with at least 9th grade education in the United States with a correlation coefficient (R) of -0.316 and weighted average of 92.7%. Similarly, the statistical analysis conducted on geographies consisting of 227,202,602 people shows a weak positive correlation between the proportion of Immigrants from Australia and percentage of population with at least 9th grade education in the United States with a correlation coefficient (R) of 0.285 and weighted average of 95.8%, a difference of 3.4%.
9th Grade Correlation Summary
| Measurement | Guyanese | Immigrants from Australia |
| Minimum | 83.3% | 91.0% |
| Maximum | 100.0% | 100.0% |
| Range | 16.7% | 9.0% |
| Mean | 93.4% | 97.9% |
| Median | 93.9% | 98.1% |
| Interquartile 25% (IQ1) | 91.2% | 96.9% |
| Interquartile 75% (IQ3) | 95.1% | 99.8% |
| Interquartile Range (IQR) | 3.9% | 3.0% |
| Standard Deviation (Sample) | 3.2% | 2.0% |
| Standard Deviation (Population) | 3.2% | 2.0% |
Similar Demographics by 9th Grade
Demographics Similar to Guyanese by 9th Grade
In terms of 9th grade, the demographic groups most similar to Guyanese are Immigrants from Dominica (92.7%, a difference of 0.020%), Tohono O'odham (92.6%, a difference of 0.020%), Japanese (92.6%, a difference of 0.040%), Immigrants from Vietnam (92.6%, a difference of 0.040%), and Immigrants from Haiti (92.7%, a difference of 0.10%).
| Demographics | Rating | Rank | 9th Grade |
| Indonesians | 0.0 /100 | #296 | Tragic 93.1% |
| Fijians | 0.0 /100 | #297 | Tragic 93.1% |
| Haitians | 0.0 /100 | #298 | Tragic 93.1% |
| Immigrants | Grenada | 0.0 /100 | #299 | Tragic 93.0% |
| Yaqui | 0.0 /100 | #300 | Tragic 92.9% |
| Immigrants | Haiti | 0.0 /100 | #301 | Tragic 92.7% |
| Immigrants | Dominica | 0.0 /100 | #302 | Tragic 92.7% |
| Guyanese | 0.0 /100 | #303 | Tragic 92.7% |
| Tohono O'odham | 0.0 /100 | #304 | Tragic 92.6% |
| Japanese | 0.0 /100 | #305 | Tragic 92.6% |
| Immigrants | Vietnam | 0.0 /100 | #306 | Tragic 92.6% |
| Immigrants | Immigrants | 0.0 /100 | #307 | Tragic 92.5% |
| Immigrants | Guyana | 0.0 /100 | #308 | Tragic 92.5% |
| Immigrants | Bangladesh | 0.0 /100 | #309 | Tragic 92.4% |
| Immigrants | Cambodia | 0.0 /100 | #310 | Tragic 92.4% |
Demographics Similar to Immigrants from Australia by 9th Grade
In terms of 9th grade, the demographic groups most similar to Immigrants from Australia are Immigrants from Belgium (95.8%, a difference of 0.010%), Turkish (95.8%, a difference of 0.010%), Immigrants from Singapore (95.8%, a difference of 0.010%), Thai (95.8%, a difference of 0.010%), and Cypriot (95.8%, a difference of 0.020%).
| Demographics | Rating | Rank | 9th Grade |
| Canadians | 99.7 /100 | #63 | Exceptional 95.9% |
| Zimbabweans | 99.7 /100 | #64 | Exceptional 95.9% |
| Immigrants | England | 99.6 /100 | #65 | Exceptional 95.9% |
| Immigrants | Netherlands | 99.6 /100 | #66 | Exceptional 95.8% |
| Cypriots | 99.6 /100 | #67 | Exceptional 95.8% |
| Immigrants | Ireland | 99.6 /100 | #68 | Exceptional 95.8% |
| Immigrants | Lithuania | 99.6 /100 | #69 | Exceptional 95.8% |
| Immigrants | Australia | 99.5 /100 | #70 | Exceptional 95.8% |
| Immigrants | Belgium | 99.5 /100 | #71 | Exceptional 95.8% |
| Turks | 99.5 /100 | #72 | Exceptional 95.8% |
| Immigrants | Singapore | 99.5 /100 | #73 | Exceptional 95.8% |
| Thais | 99.5 /100 | #74 | Exceptional 95.8% |
| Inupiat | 99.5 /100 | #75 | Exceptional 95.8% |
| Immigrants | Sweden | 99.5 /100 | #76 | Exceptional 95.8% |
| Whites/Caucasians | 99.4 /100 | #77 | Exceptional 95.8% |